Download the PDF version of this newsletter.
In This Issue:
- From the Director
- Retrospective: CASC Collaborations to Improve Algorithms for Laser Plasma Interaction Simulation at NIF
- Collaborations: Debris and Shrapnel Modeling for NIF
- Lab Impact: Improving the Modeling of Radiation Transport in Hohlraum Simulations at NIF
- Advancing the Discipline: Topological Data Analysis and Visualization to Support Complex NIF Simulations and Surrogate Modeling
- Machine Learning & Applications: Predictive Modeling Techniques for Nanosecond-Laser Damage Growth in Fused Silica Optics
From the Director
Contact: Jeff Hittinger
“The man who moves a mountain begins by carrying away small stones.” – Confucius
At 1 a.m. on the morning of December 5, 2022, the National Ignition Facility (NIF) had a significant breakthrough: the inertial confinement of a compressed target was just good enough to initiate thermonuclear burn. For the first time, humanity achieved net gain from a controlled fusion reaction within a laboratory; the lasers delivered 2.05 MJ of energy, resulting in 3.15 MJ of fusion energy output. This achievement—over in the blink of an eye (tens of nanoseconds)—was the result of over two decades of work on NIF, six decades after John Nuckolls conceived of the possibility of laser-driven inertial confinement fusion (ICF). We congratulate our current and former colleagues across the Lab for this tremendous achievement.
Of course, CASC itself has reason to celebrate this success. CASC and NIF are siblings of a sort, both starting within a year of each other in the 1990s. As such, it should not be surprising that challenging ICF problems have been a focus of research in CASC throughout its existence. Over the years, CASC researchers have made both direct and indirect impacts on the NIF program—from being deeply involved in the design of ignition targets (Jose Milovich) to helping NIF operations more effectively handle shot scheduling (Claudio Santiago). In this edition of the CASC Newsletter, we highlight five more exemplars of CASC’s many contributions to the efforts to make controlled laboratory fusion possible.
For more than two decades, CASC researchers have partnered with computational physicists in the Weapons Simulations and Computing (WSC) program within Weapons and Complex Integration (WCI) to create new simulation capabilities to understand the complex multiphysics processes involved in ICF. In this issue, we feature a retrospective from Milo Dorr about some of these efforts to address laser-plasma interactions. We also highlight the important role of CASC Computational Scientist Nathan Masters leading the NIF Debris & Shrapnel Working Group, which uses sophisticated WSC codes to analyze the production and trajectories of fragments that could damage expensive NIF optics. For many years, several members of CASC—including Gary Kerbel (retired), Britton Chang (retired), and now Milan Holec—have helped to develop WSC’s HYDRA radiation hydrodynamics code for hohlraum physics1, and we feature a short article on Milan’s recent work on a novel deterministic transport algorithm. In the data sciences, this issue features the topological data analysis methods, developed by Timo Bremer and Shusen Liu, that have provided new insights into the high-dimensional structure of NIF data. Finally, we present a data-driven approach developed by Ghaleb Abdulla in collaboration with NIF scientists to predict the growth of inclusions and damage in NIF optics for the purpose of data-informed maintenance scheduling.
1In indirect drive ICF, the hohlraum is the small, metal cylinder that serves as an X-ray oven for the enclosed bead of fuel.
Retrospective | CASC Collaborations to Improve Algorithms for Laser Plasma Interaction Simulation at NIF
Contact: Milo Dorr
To ensure that the energy transported in NIF’s 192 beams arrives on target as intended during an ignition shot like the one last December, it is essential to account for beam interactions with the plasma generated by the ablating target capsule. Laser Plasma Interaction (LPI) is therefore an important topic in the inertial confinement fusion design space, and LPI simulation in the NIF context is a computationally daunting task.
LPI simulation at NIF requires wavelength-scale resolution in multiple beams that are each thousands of wavelengths wide on timescales of 10 ns laser pulses. Though this might seem like a small time to simulate, it requires a lot of precision. Such micron-scale spatial resolution needs to be combined with speed-of-light velocities in a 10-mm-long hohlraum containing the target capsule.
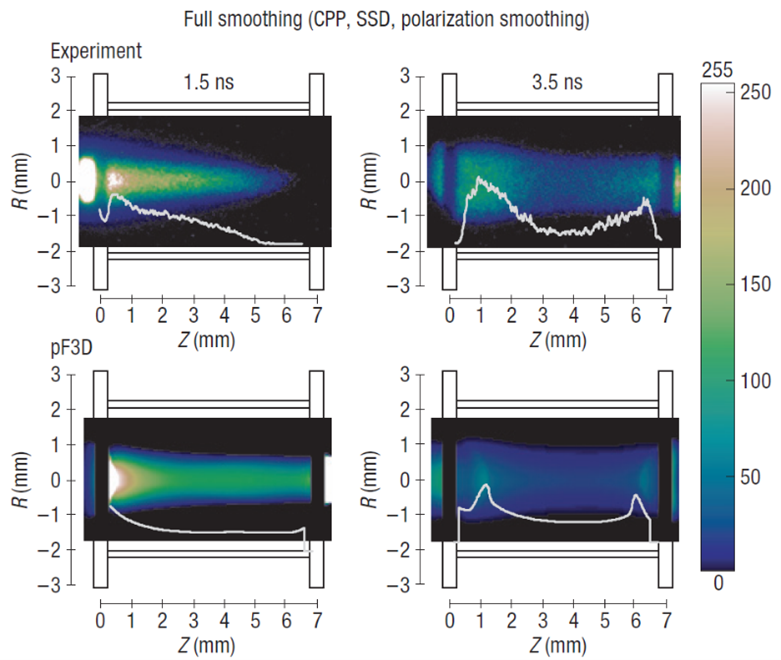
For many years, the pF3D code has been the primary LPI modeling tool for NIF, developed and maintained by the High Energy Density-ICF Physics & Design Group in the WCI Design Physics Division. Motivated by the algorithmic challenges and the opportunity to support a major Laboratory program, CASC researchers, led by Milo Dorr, began collaborating with the pF3D team in NIF’s early days to investigate numerical algorithms for improving the efficiency and accuracy of LPI simulations. This resulted in the development of a nonlinear multi-species hydrodynamics package based on a high-resolution Godunov method, and a Spitzer-Härm electron transport package incorporating mesh refinement and a custom multigrid solver [1]. Implemented in pF3D, these algorithmic enhancements were used to perform simulations of LPI in gaspipe target experiments conducted as part of the NIF Early Light (NEL) campaign utilizing the first beam quad installed at the new facility. Comparisons of the computed results with NIF measurements of the effect of various beam smoothing strategies on laser propagation (Figure 1) were included in NIF’s first-ever publication in Nature Physics [2].
Supported by the Laboratory Directed Research and Development (LDRD) program, CASC researchers also explored the potential use of adaptive mesh refinement (AMR) for LPI simulation through the development of the experimental code ALPS (Adaptive Laser Plasma Simulator) [3]. The motivating idea was to use AMR to deploy high grid resolution only around laser speckles where the laser intensity and the associated risk of deleterious LPI is highest (Figure 2). ALPS utilized CASC’s newly-developed Structured Adaptive Mesh Refinement Application Infrastructure (SAMRAI) and hypre linear solver libraries.
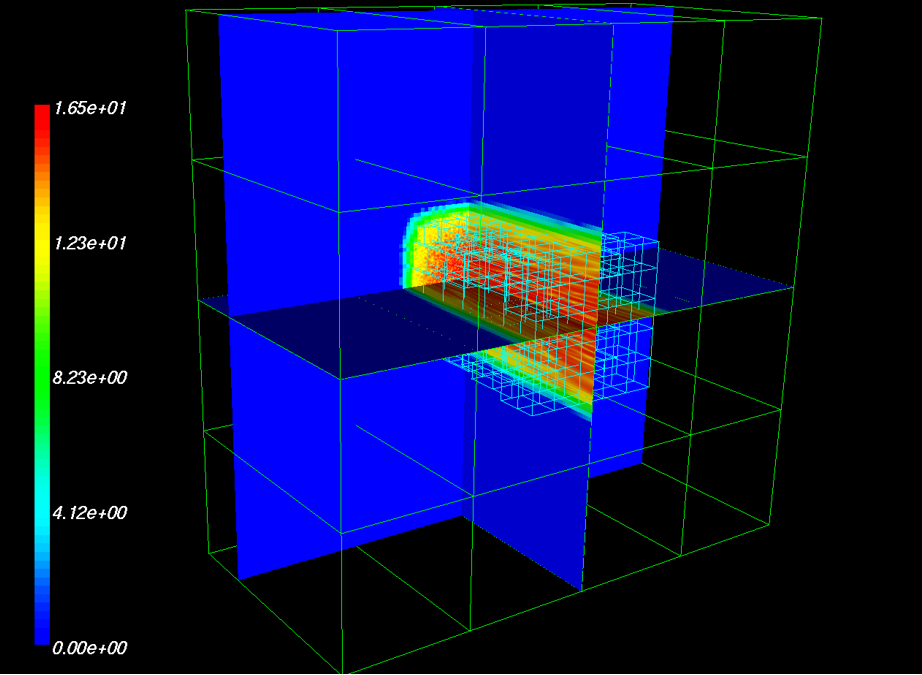
Figure 2: Slice plot of the ALPS-computed light intensity (log10(W/cm2)) resulting from the propagation of a laser beam through a random phase plate into a tenth critical CH plasma. The computational domain is 1000 λ x 1000 λ x 500 λ, where λ = 351 nm is the light wavelength. The light blue boxes at the center of the figure indicate the adaptively refined region, which is eight times finer than the underlying coarse grid in each coordinate direction.
Because ALPS enabled multiple beams to be gridded at higher resolution than that needed for the surrounding plasma fluid model, it was also applied to simulate energy transfer between crossing beams. Such transfer results from a resonant interaction of the electromagnetic waves comprising the beams with plasma ion acoustic waves in the region where the beams cross. The ability to predict and quantify cross-beam energy transfer is important in the design of NIF experiments that move power between beams to improve the symmetry of the target implosion as well as reducing undesirable LPI effects in specific beam cones.
CASC researchers also collaborated with the pF3D team in the development of a specialized (i.e., independent of both pF3D and ALPS) three-wave, paraxial wave code named Xbeam to study crossed-beam energy transfer [4,5,6]. Xbeam utilized the IDA differential-algebraic equation solver from the CASC SUNDIALS package to implicitly integrate the nonlinear paraxial system.
pF3D is used regularly and will continue to be used when building the case for further upgrading NIF to higher powers and energies, where laser intensity, plasma scale lengths, and LPI concerns will all increase.
[1] J. Hittinger and M. Dorr. “Improving the Capabilities of a Continuum Laser Plasma Interaction Code.” In Proceedings of the 2nd Annual Scientific Discovery Through Advanced Computing Conference (SciDAC 2006), J. Phys. Conf. Ser. 46, 2006.
[2] S. Glenzer et al. “Experiments and Multiscale Simulations of Laser Propagation Through Ignition-Scale Plasmas.” Nature Physics, vol. 3, 2007.
[3] M. Dorr, F. Garaizar, and J. Hittinger. “Simulation of Laser Plasma Filamentation Using Adaptive Mesh Refinement.” J. Comput. Phys., vol. 177, no. 2, pp. 233-263, 2002.
[4] J. Hittinger, M. Dorr, R. Berger, and E. Williams. “Simulating Time-Dependent Energy Transfer Between Crossed Laser Beams in an Expanding Plasma.” J. Comput. Phys., vol. 209, no. 2, pp. 695-729, 2005.
[5] E. Williams et al. “Effects of Ion Trapping on Crossed-Laser-Beam Stimulated Brillouin Scattering.” Phys. Plasmas, vol. 11, pp. 231-244, 2004.
[6] R. Kirkwood et al. “Observation of Saturation of Energy Transfer Between Copropagating Beams in a Flowing Plasma.” Phys. Rev. Lett., vol. 89, no. 21, p. 215003, 2002.
Collaborations | Debris and Shrapnel Modeling for NIF
Contact: Nathan Masters
NIF’s 192 laser beams and their optics are protected by 3 mm thick borosilicate glass Disposable Debris Shields (DDS), which are relatively inexpensive and can be easily swapped. All optics upstream of the DDS are orders of magnitude more expensive, with few spares, and require significant downtime for replacement. Therefore, predictions of the nature, trajectory, and speed of target debris and their potential consequences are needed to determine appropriate risk management strategies that balance facility and user—including programmatic—interests, as damage to more than a few DDS or any of the upstream optics would incur a significant expense and schedule disruption.
The NIF Debris & Shrapnel Working Group (D&S), led by CASC researcher Nathan Masters, assesses all NIF targets and diagnostics for potential threats posed by the experiments, and works with the experimental teams and the facility to minimize risks. D&S uses a variety of tools to “protect the facility and facilitate the science” including ARES for laser-target interactions and target response to identify solid and molten shrapnel; ALE3D and DYNA3D/ParaDyn for structural responses to distributed debris wind or X-ray ablative loads and discrete impacts; and analytical and empirical models.
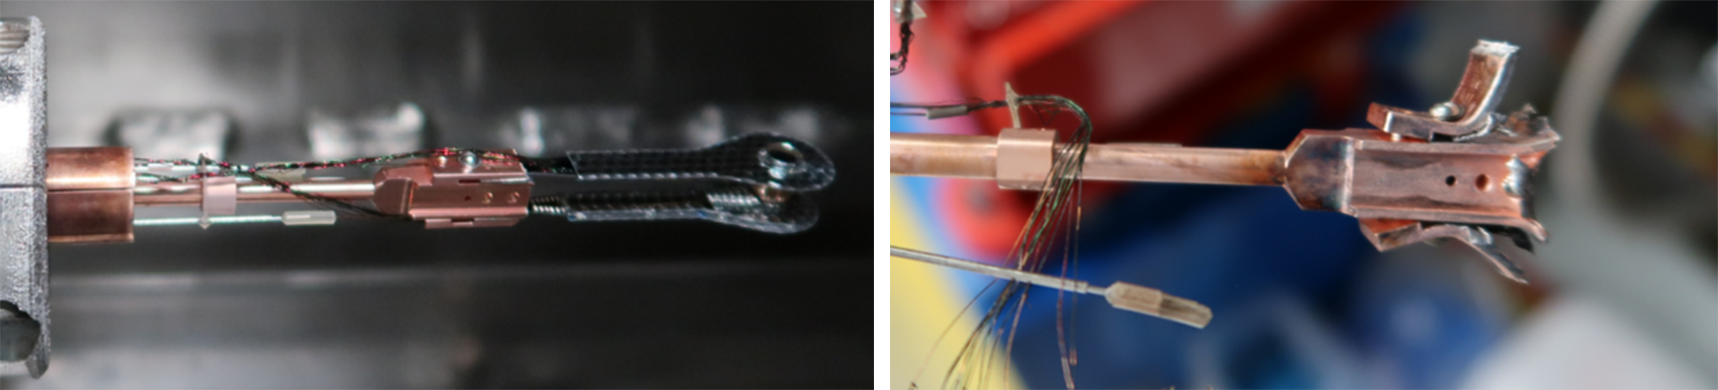
In the recent 60 Minutes report on the first ever ignition shot [1], reporter Scott Pelley referred to the spent copper target stalk as “an artifact, like Bell’s first phone or Edison’s light bulb... This thing is going to end up in the Smithsonian.” Figure 3 shows the target stalk before and after this shot. These stalks are intended for single use, but should not generate secondary debris risks. On two previous shots, clamps have failed and dropped into the target chamber—posing a risk to optics and motivating redesign.
With increasing drive energies and fusion yield, the loads on diagnostics and target positioners also increase. D&S team member Bryan Ferguson (Laser Systems Engineering and Operations) simulated the current stalk design and a design proposed by the D&S team with stiffer clamps and an extended arrow-head “knuckle” (see Figure 4). These simulations predicted enhanced survivability, and the new design will be used on targets later this year.
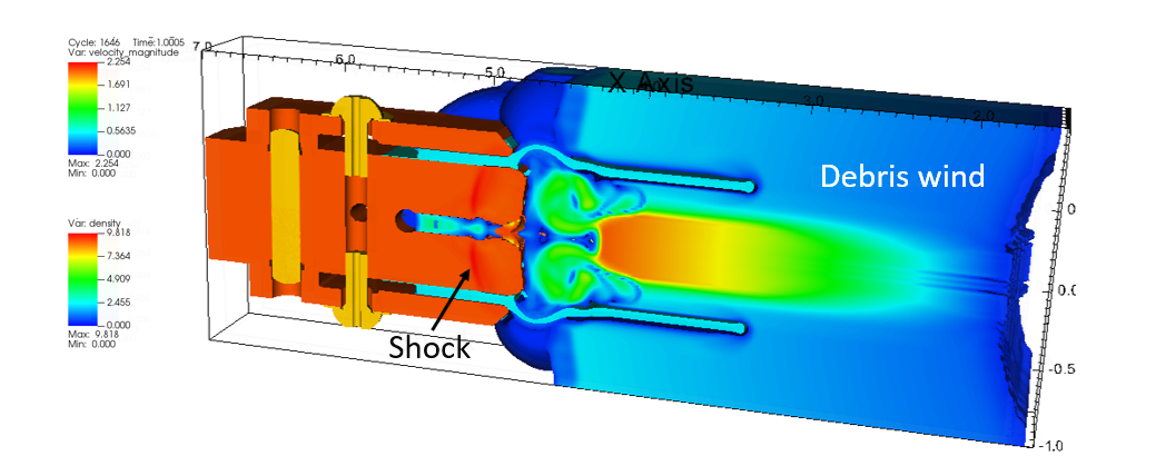
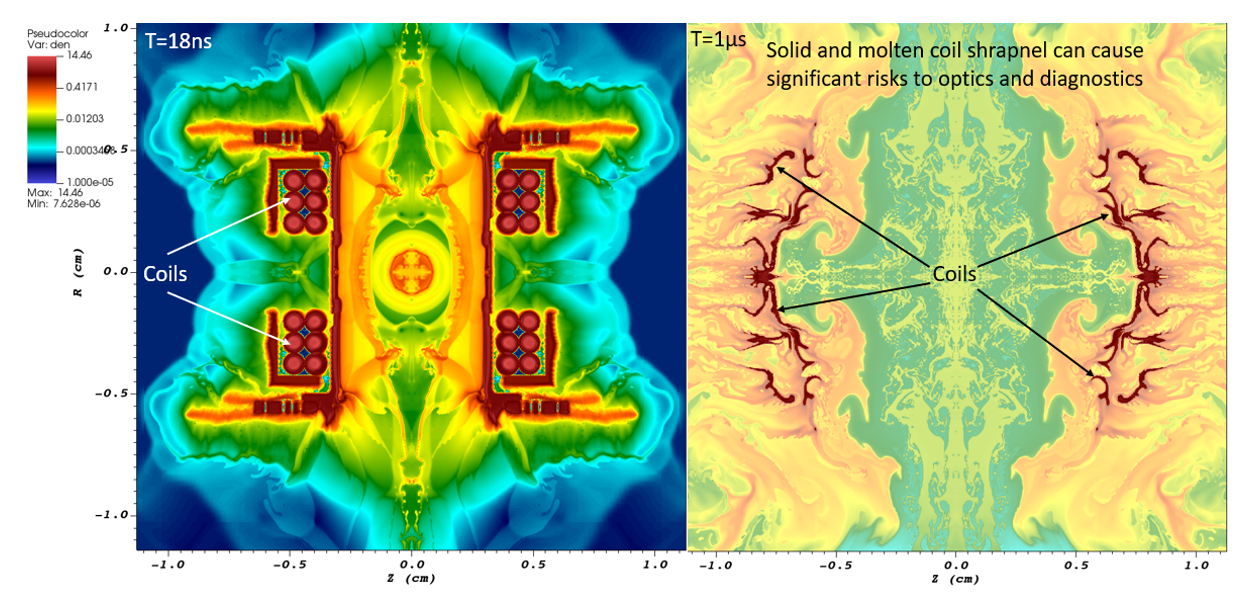
NIF has recently added a pulse power system to drive high currents and strong magnetic fields on NIF targets to study astrodynamic effects, enhance X-ray generation, or improve inertial confinement fusion (ICF) capsule performance [2]. These coils increase the mass of the target—which must be assessed for potential threats, including increased debris load on the target stalk and shrapnel on optics and diagnostics. Figure 5 presents simulation results for a magnetized ICF hohlraum used to identify solid and molten debris after the pulse has reached the target. The trajectory and sizes of the debris identified in this simulation pose acceptable risks to the optics. The increased load on the target stalk and diagnostics will require further assessment of those structures, particularly at higher drive energies and yields.
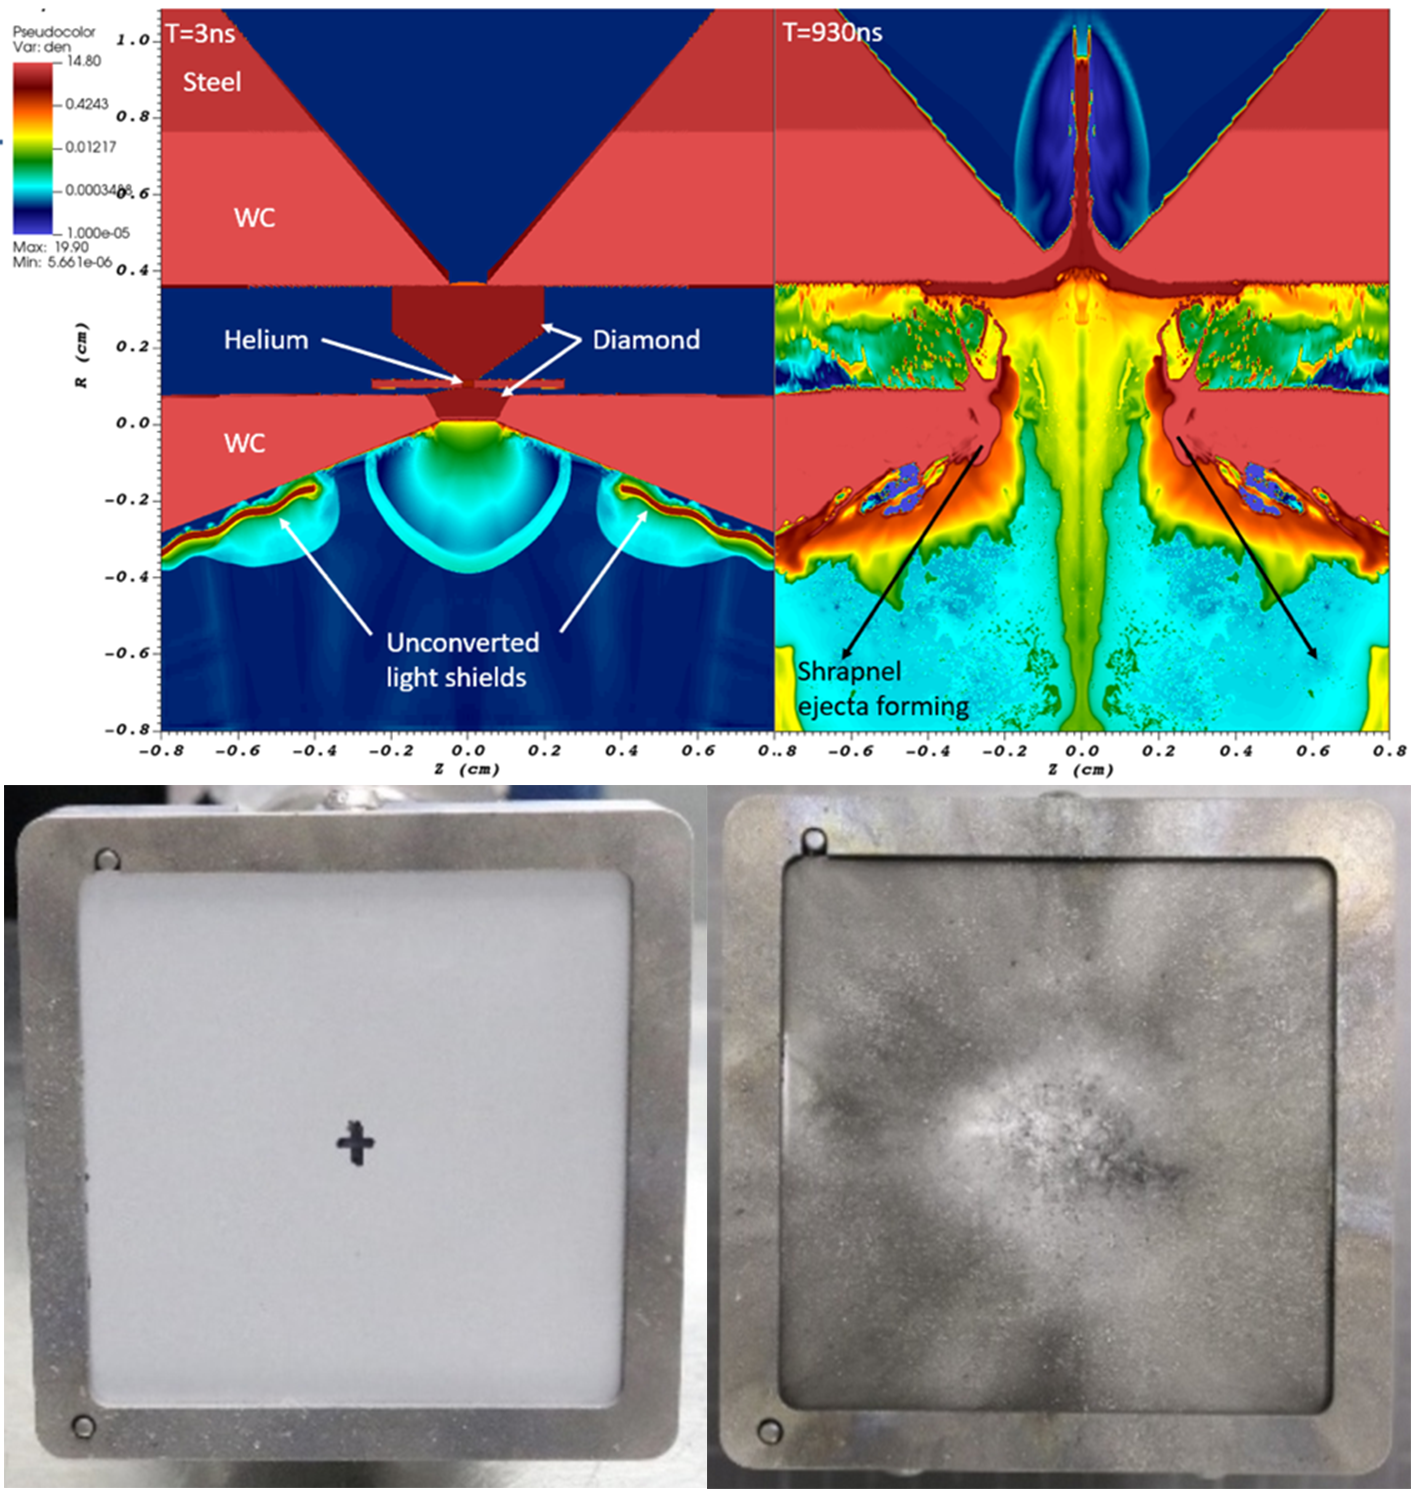
In addition to ICF, NIF is a user facility with basic science and programmatic experiments exploring many phenomena. Several Diamond Anvil Cell (DAC) experiments have been fielded recently [3]. These pre-compress samples of low-Z matter, such as helium, to high pressure during assembly using a DAC and then drive this to even higher pressures with NIF beams. The DAC consists of a pair of diamond anvils, supported by larger tungsten carbide (WC) and steel features—all potential debris sources in response to the laser drive. Simulations predicted that, while there would be a nominal risk to the participating lower beams from material blown off the lower side of the DAC target, there could be significant damage to the upper WC support which could fragment into millimeter scale pieces that could fall on optics (see Figure 6 (top)). This was mitigated by placing a passive diagnostic (PRAD) in close proximity to the DAC to absorb the initial insult, as can be seen in the fragments on top of the DAC and pre- and post-shot photos of the impact damage on the PRAD filters in Figure 6 (bottom).
[1] Nuclear Fusion: Inside the breakthrough that could change our world | 60 Minutes – YouTube.
[2] J. Moody et al. “Increased Ion Temperature and Neutron Yield Observed in Magnetized Indirectly Driven D2-Filled Capsule Implosions on the National Ignition Facility.” Phys. Rev. Lett., vol. 129, no. 19, p. 195002, 2022.
[3] Y.-J. Kim. “Shock Compression of Statically Precompressed Low-Z Materials.” APS March Meeting 2022, abstract id.N15.002.
Lab Impact | Improving the Modeling of Radiation Transport in Hohlraum Simulations at NIF
Contact: Milan Holec
Hohlraum simulations play a critical role in the Inertial Confinement Fusion program within NIF. To aid in these simulations, CASC researcher Milan Holec demonstrated a unique deterministic transport method capable of modeling capsule compression.
HYDRA is a multi-physics code, developed by WSC, that is used to simulate a variety of experiments carried out at NIF. It has packages to simulate radiation transfer, atomic physics, hydrodynamics, laser propagation, and a number of other physics effects. Recently, Holec developed a high-order-low-order blending strategy to provide accurate, robust, and computationally efficient radiation transport model in hydrodynamic simulations with HYDRA. He developed a new discretization approach for radiation transport, called unlocked polar SN, which excels in mitigating the rays-effect and provides a conservative, positivity preserving method that obeys the correct diffusion limit.
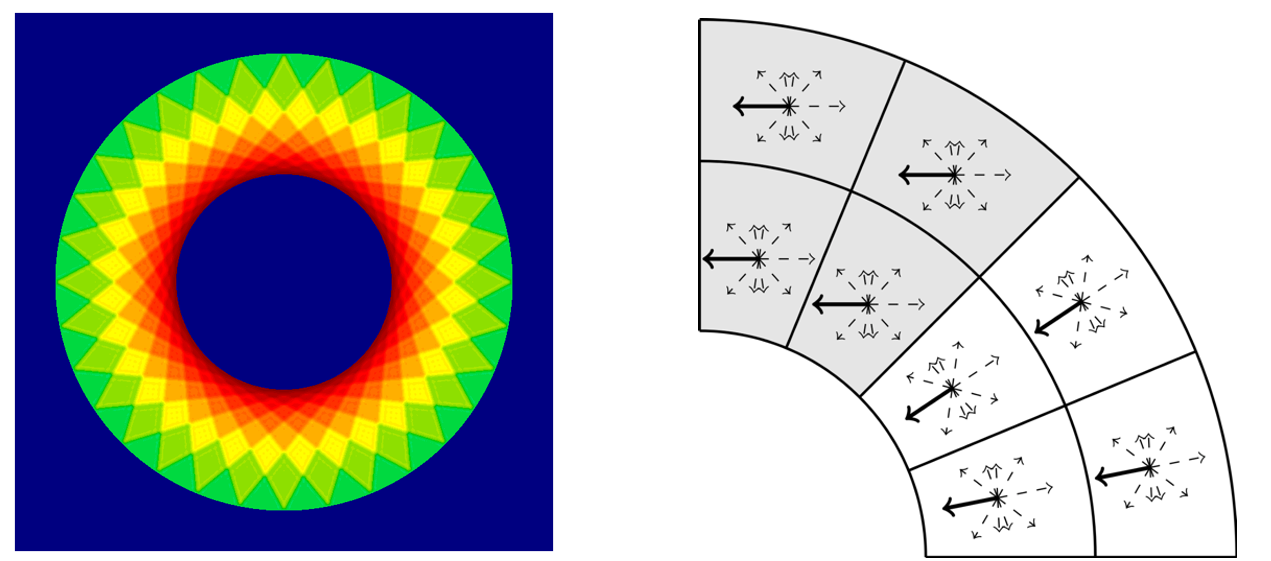
Figure 7: (left) Standard SN suffers from the rays-effect even in a perfectly spherical transport example, and (right) Spatially rotating angular system of polar SN (white cells) vs. standard fixed angular system (gray cells).
The rays-effect, commonly present when using standard SN (see Figure 7 (left)), arises from the mesh imprint of angular dimensions of the phase-space discretization. Polar SN addresses this issue by “adjusting” the angular mesh, or angular quadrature, by orienting it with respect to the center of a sphere, such as an ICF capsule. Figure 7 (right) schematically shows the difference between standard SN (gray cells) and rotated polar SN (white cells). HYDRA takes advantage of the polar SN, as shown in Figure 8, such that a perfectly spherical compression of an ICF capsule can be launched without any hydrodynamic instabilities seeded by numerical rays-effect.
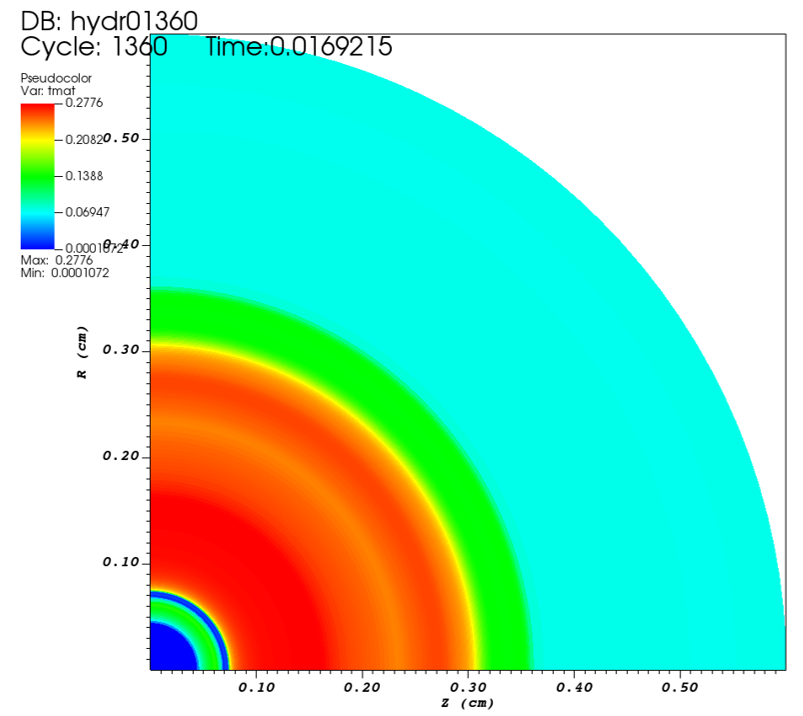
Figure 8: Polar SN radiation drive model in HYDRA leads to a perfectly spherical capsule compression making it a unique deterministic transport method.
The polar SN concept is implemented using a blend of higher order diamond difference (DD) and low-order step method that ensures positivity of radiation field and temperature. A particularly challenging moment appears when radiation drive hits cold surface of the capsule ablator as shown in Figure 3(left), exhibiting a sharp change in opacity. Pure high-order DD clearly breaks the physical concept of positivity (solid red line), causing numerical instability. In contrast, the blend of DD and step methods leads to an accurate solution that is positive, conservative, and obeys the radiation transport diffusion limit. The proper diffusion limit, however, requires a method of “unlocking” developed by Milan and his collaborators at WCI and NIF [1].
The researchers demonstrated the correctness of the diffusion limit by simulating an optically thick, spherically symmetric Marshak wave accelerated by nonlinear diffusion synthetic acceleration (NDSA) for an efficient computation of coupling between radiation and plasma temperature. Unlike the vast majority of coupling methods based on radiation pseudo-scattering, NDSA focuses on plasma temperature, which makes it a unique approach pertaining to the class of photon-free-methods (PFMs). This is relevant in ICF, where the internal energy density of plasma represented by temperature plays a dominant role over the radiation energy density in optically thick plasma in indirect drive hohlraum experiments [2].
Results at the time of peak compression (conditions for ignition and burning plasma) of perfectly symmetric compression and of a compression with 50 Angstrom perturbation of single mode l=30 on the capsule surface are shown in Figure 9 (right). These simulations show excellent accuracy of the radial profile of the ablator-fuel interface: the symmetry is maintained, and the growth factor of the small perturbation maintains the linear regime (no higher modes arise). The group is currently exploring the general theory and extension of the unlocked polar SN in a Laboratory Directed Research and Development (LDRD) project.
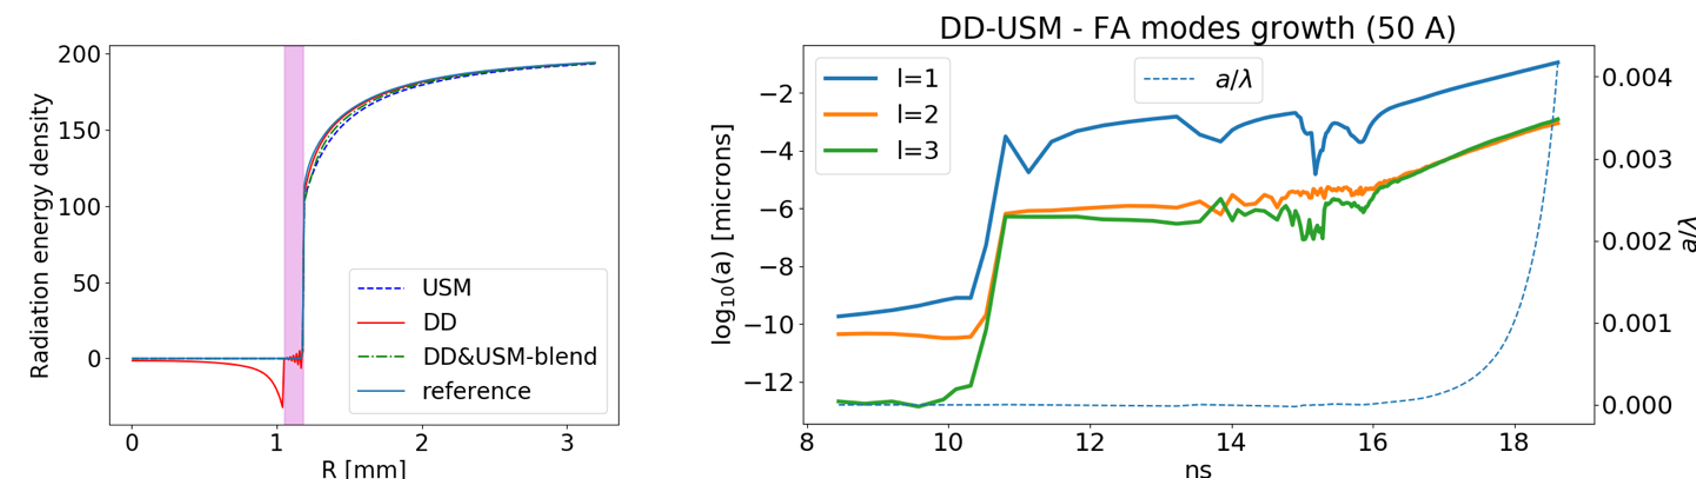
Figure 9: (left) Unlocked polar SN preserves positive radiation field based on high-order diamond difference (DD) and low-order unlocked step method (USM) where the negativity manifests at the sharp opacity interface between the outer gas and capsule ablator (magenta); and (right) radial profile of fuel-ablator interface at the time of peak compression of ICF capsule. Symmetry preservation (orange line) and linear growth of initial cosine perturbation (blue line) are shown.
[1] M. Holec, B. Southworth, T. Haut, and B. Yee. “Nonlinear Diffusion Synthetic Acceleration of Thermal Radiative Transfer.” In Proceedings of the International Conference on Mathematics and Computational Methods applied to Nuclear Science and Engineering, 2021.
[2] A. Kritcher et al. “Design of Inertial Fusion Implosions Reaching the Burning Plasma Regime.” Nature Physics, vol. 18, 2022.
Advancing the Discipline | Topological Data Analysis and Visualization to Support Complex NIF Simulations and Surrogate Modeling
Contact: Shusen Liu and Timo Bremer
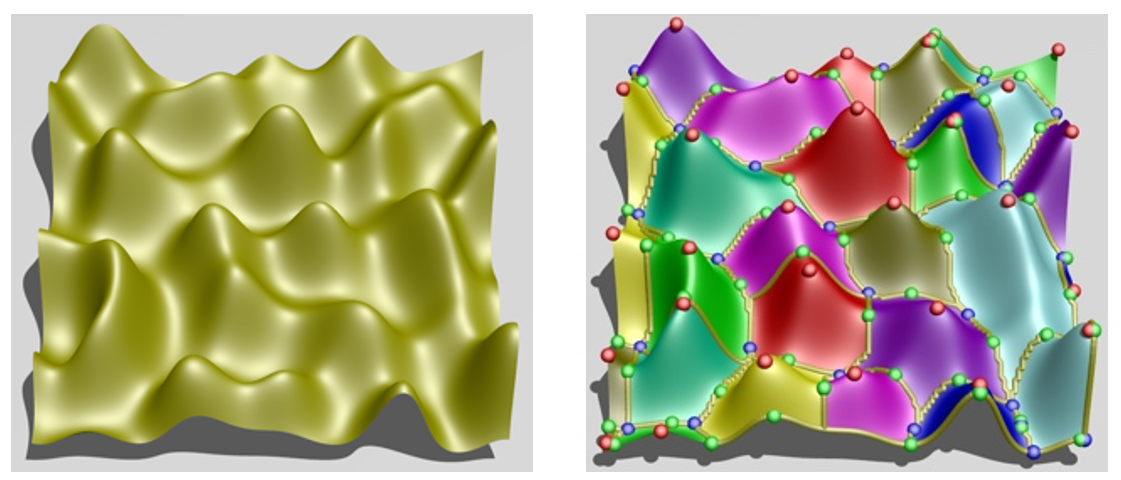
Topology, specifically Morse Theory, studies the fundamental invariants of functions in arbitrary dimensions. In particular, it can be used to compute the Morse complex of a structure, which is conceptually similar to segmenting individual mountains in a complex terrain (see Figure 10). However, unlike traditional segmentation approaches, topology is inherently defined in higher dimensions and gives rise to a multi-scale representation that can be used to perform important tasks, such as removing noise or simplifying functions. CASC researchers Shusen Liu and Timo Bremer have developed an open-source toolkit, called N-dimensional Data Analysis and Visualization (NDDAV), to compute and analyze high-dimensional functions based on Morse Theory. The NDDAV framework has been used in a wide variety of applications, including to support complex NIF simulations and surrogate modeling.
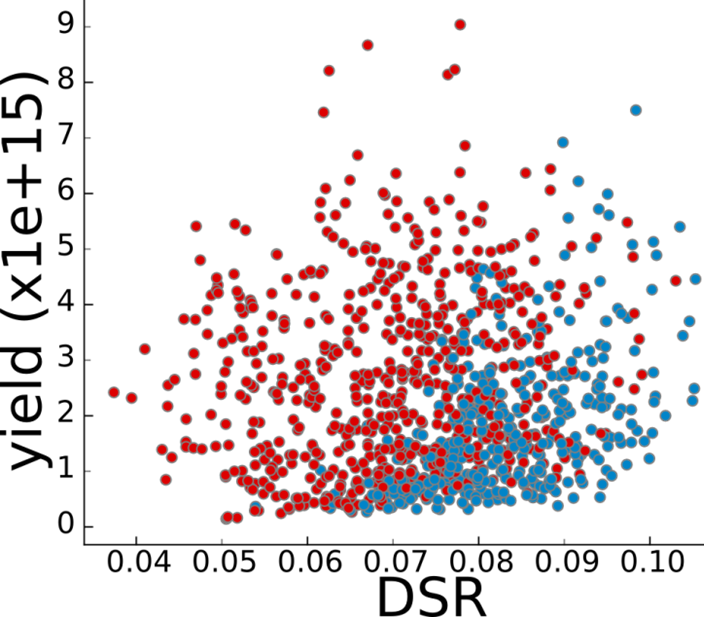
One of the earlier applications [1] of NDDAV to NIF simulations is to help identify conditions that can lead to high yield. Bremer, along with collaborators from WCI, NIF and University of Utah, used NDDAV to compute topological segments (“mountains”) for an ensemble of thousands of 2D HYDRA simulations. Figure 11 shows a scatterplot of the relationship between the downscatter ratio (DSR) and the ultimate yield of the implosion, colored using the topological segments computed from NDDAV. The ensemble varied 5 different input parameters, and analyzing the yield as a 5-dimensional function based on these input parameters revealed two strong and well separated “mountains.” Essentially, the topological analysis demonstrated that within the ensemble, there were two very different conditions (colored red and blue) that can lead to high yield.
Another application of NDDAV was to help design, debug, and interpret a complex multi-modal surrogate model aimed at emulating simulations of NIF shots [2]. The model maps a 5-dimensional parameter space onto a set of scalars and images describing the output of the simulation. The model itself uses a number of different loss functions, each aimed at different aspects of the fitting, such as the forward error, the physical consistency, etc. One challenge with the traditional approach of judging a model by its global error is that it tends to obscure outliers and provides little insight into the underlying behavior. In this example, multiple models at different sample sizes (100k, 1M, and 10M samples) all showed a well converged global error. However, NDDAV made it possible to directly analyze and visualize the different loss surfaces defined over the 5-dimensional input space, thus providing insights into the local behavior of the errors. Specifically, it demonstrated that the model fitted on a sample size of only 100K did not, in fact, converge, but had multiple, albeit small, regions in parameter space with abnormally high error. Similarly, even the initial large model demonstrated individual outliers in the data that could not be fitted within the standard training process. These were ultimately deemed artifacts of the data production that could not have been found using traditional global approaches.
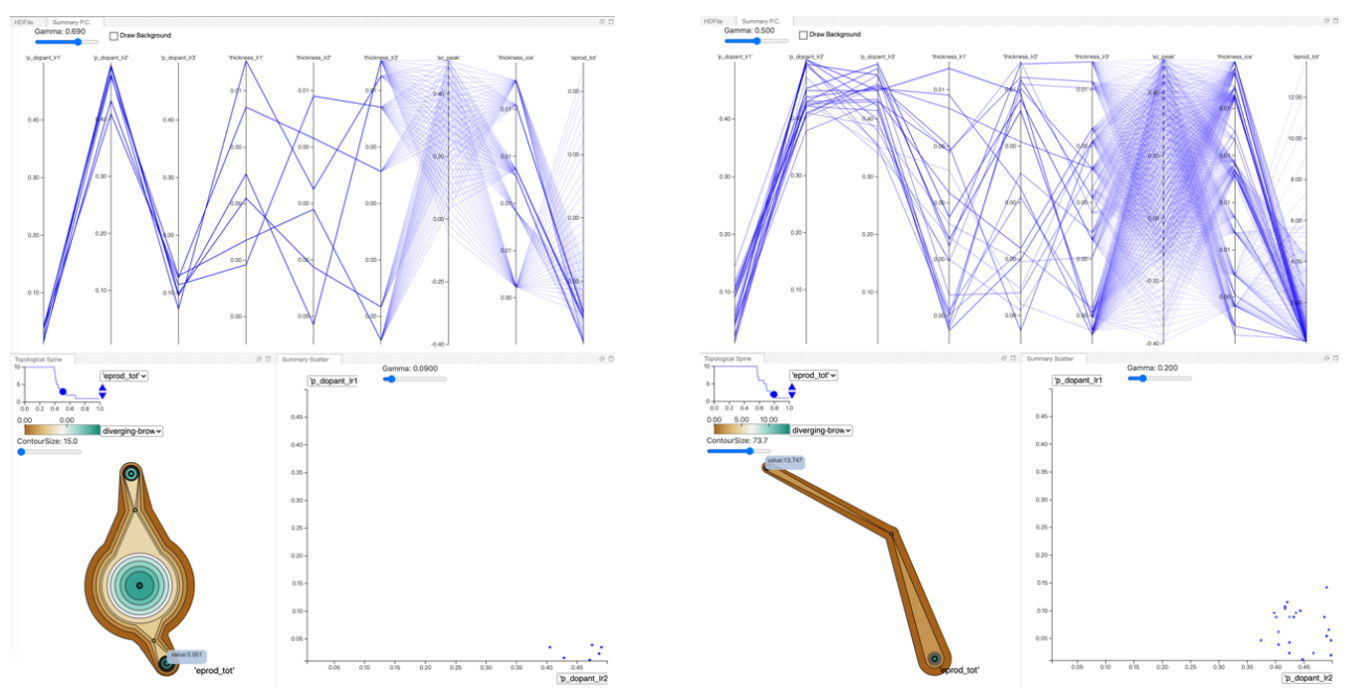
More recently, NDDAV has been crucial for understanding the behavior of multi-fidelity NIF simulations. In a resource constrained environment, it is often desirable to dedicate more computing resources for higher fidelity simulations, when it is more likely to produce results relevant to the application objective, such as higher yield. One of the major challenges is to determine where in the parameter space to run the low-fidelity vs. the high-fidelity simulations. This is where topological data analysis combined with high-dimensional data visualization in NDDAV can be particularly valuable. The topological data analysis can uncover the meaningful peaks and its sample composition. Then the geometric information obtained from the visualization can locate and compare the peaks in the input parameter space. In Figure 12, the left pane shows the visualization of the low fidelity function, whereas the right pane shows the high fidelity. In the current visualization configuration, the bottom left view shows a terrain metaphor of the high-dimensional function. As evident from the terrain visualization, these two functions have rather different topological structures. More importantly, the global peaks from both functions are different significantly along one of the input parameter dimensions, which is rather unexpected. Going forward, this can greatly influence how to design and tune the multi-fidelity surrogate.
[1] P.-T. Bremer et al. “ND2AV: N-Dimensional Data Analysis and Visualization Analysis for the National Ignition Campaign.” Computing and Visualization in Science, 17(1), 1-18, 2015.
[2] S. Liu et al. “Scalable Topological Data Analysis and Visualization for Evaluating Data-Driven Models in Scientific Applications.” IEEE Transactions on Visualization and Computer Graphics, 26(1), 291-300, 2019.
Machine Learning & Applications | Predictive Modeling Techniques for Nanosecond-Laser Damage Growth in Fused Silica Optics
Contact: Ghaleb Abdulla
Laser-induced damage on the exit surface of fused silica optics is a topic of considerable interest for large aperture, high-power laser systems such as NIF, and machine learning (ML) can be a powerful predictive tool to improve the understanding of the optics damage growth process.
CASC researcher Ghaleb Abdulla was involved in a Laboratory Directed Research and Development (LDRD) project to understand and track growing or damage sites for mitigation before they reach a certain size. He developed predictive modeling techniques to characterize damage growth rate and behavior that can be used to help schedule NIF optics maintenance. Specifically, he applied data mining and ML techniques to build better predictive models for optics damage growth.
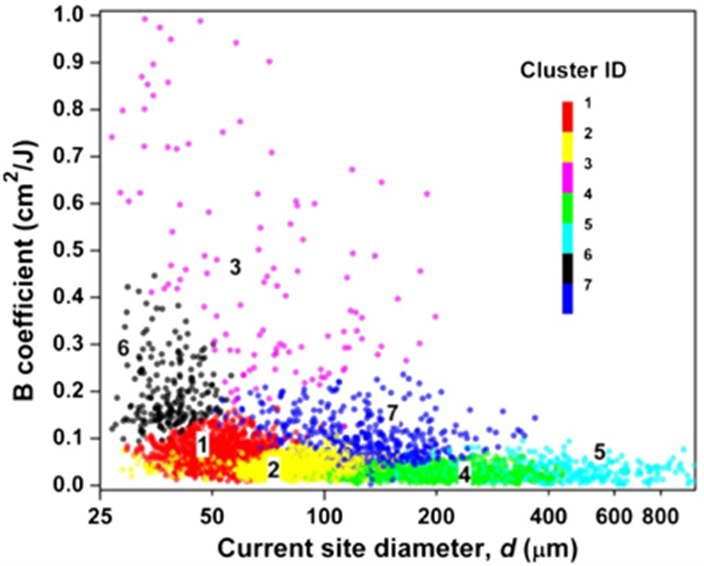
In this project, one of their initial findings [1] was that much of the scatter in previous growth observations was due to parameters that were not previously known to affect growth rate, namely the temporal pulse shape of the laser and the size of a site. The remaining variability observed in the rate at which sites grow is well described in terms of the Weibull statistics. The effects of site size and laser fluence may both be expressed orthogonally in terms of Weibull coefficients. To explore the multiparameter growth space and expose average growth trends, the researchers used an expectation-maximization clustering algorithm with three input parameters. This analysis approach identified sites likely to exhibit growth rates outside the norm. The ability to identify which sites are likely to grow abnormally fast in advance of the manifestation of such behavior significantly enhanced the accuracy of predictive models over those based on average growth behaviors.
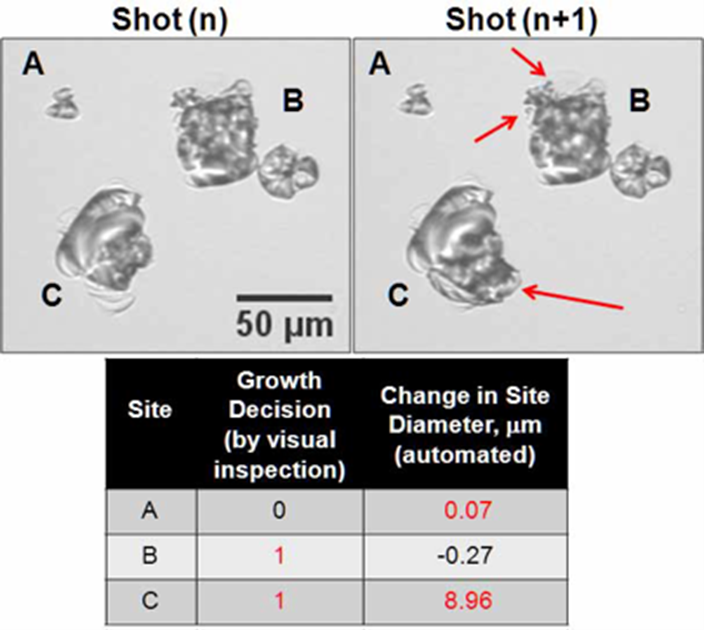
An important observation is that with identical laser conditions, there is a widespread in site response (growth rate) that cannot be accounted for by laser parameters only. The research team showed that the onset of damage growth is not governed by a laser fluence threshold, but is probabilistic in nature. It depends on the current morphology and size of a damage site as well as the laser fluence to which it is exposed [2]. They also showed that the history of laser exposure influences the behavior of individual sites. The shot-to-shot independence to the probability of growth indicated that internal features of the damage sites evolve with each laser exposure even if such changes do not manifest as observable changes to the site diameter. The results from this study had important implications for the development of predictive models on laser damage evolution, from initiation to a preset size imposed by various damage repair protocols. Detailed knowledge of how damage sites respond to laser exposure as a function of size can be used in adding efforts to post-process optics to make them more robust.
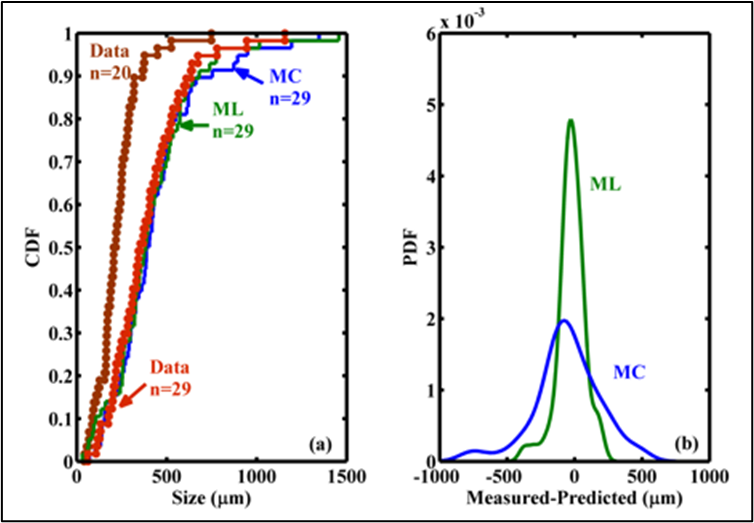
The research team also used historical data to predict future damage sizes over a series of laser shots. To build a predictive model using a classifier, they organized the data temporally per site and used two thirds of the data for training and one third for testing. The results [3] showed that both Monte-Carlo (MC) simulation and supervised ML can accurately reproduce the evolution of a population of damage sites over ten or more laser future shots, depending on the size range. Although the MC technique is more flexible in terms of applying to different data sets, its outcome may not be as accurate as that of the ML classifier technique. However, the classifier technique would require stronger oversight to ensure the training data and prediction data are consistent with each other.
[1] Z. Liao, G. Abdulla, R. Negres, D. Cross, and C. Carr. “Predictive Modeling Techniques for Nanosecond-Laser Damage Growth in Fused Silica Optics.” Optics Express, 20(14), 2012.
[2] R. Negres, G. Abdulla, D. Cross, Z. Liao, and C. Carr. “Probability of Growth of Small Damage Sites on the Exit Surface of Fused Silica Optics.” Optics Express, 20(12), 2012.
[3] R. Negres, Z. Liao, G. Abdulla, D. Cross, M. Norton, and C. Carr. “Exploration of the Multi-Parameter Space of Nanosecond-Laser Damage Growth in Fused Silica Optics.” Applied Optics, 50(22), 2011.
CASC Newsletter Sign-up
Was this newsletter link passed along to you? Or did you happen to find it on social media? Sign up to be notified of future newsletters.
Edited by Ming Jiang. LLNL-MI-851177