
Disclaimer: This article is more than two years old. Developments in science and computing happen quickly, and more up-to-date resources on this topic may be available.
In This Issue:
- From the Director: Perspectives on Machine Learning and AI in Science
- Advancing the Discipline: Opening the Black Box of Data Driven Models
- Lab Impact: Autonomous Vehicle Operations in Future Networked Smart Highways with Heavy Vehicle Platooning Research
- Collaborations: Debugging Interface Officially Became Part of the OpenMP Standard 5.0
- Highlights
From the Director | Perspectives on Machine Learning and AI in Science
Machine learning (ML) and artificial intelligence (AI) are the hot topics of the day despite their long history in the field of computing, with learning algorithms and neural networks first explored in the 1950's. The recent commercial successful uses of ML and AI in areas such as image recognition, social networks, and autonomous vehicles have renewed interest and elevated expectations, perhaps to unattainable heights. Despite the hype, our scientific and national security missions can and are being enhanced through the use of increasingly sophisticated learning techniques, particularly as our ability to produce, acquire and manage more data grows. However, the Laboratory's use of ML and AI places new concerns and demands on these algorithms that may not have been critical in commercial settings. Consider just a few of the challenges identified in the recent DOE ASCR Scientific Machine Learning report:
- Model development: At their core, ML and AI algorithms produce models that map inputs to outputs. The structure of the model is an assumption and introduces the largest opportunity for creativity into the process. Think linear regression: you assume the form of a line and then use least squares to fit the slope and intercept to minimize the L2 distance of all of the data points. Similarly, one might assume a particular set of basis functions or design a multilevel convolutional network. Each of these choices introduces unknowns (like the slope and intercept). In addition, one needs to define some metric to minimize (like the L2 distance) since the data far outnumber the degrees of freedom in the model. Given a problem and a collection of data, how does one select an appropriate model form and metric? The answer—experience, intuition, and (most often) trial and error—is not satisfying.
- Robustness: Another observation about many of the more sophisticated learning techniques—especially those based on neural networks—is they are not always robust. Permutating the order of data in the training set can result in a completely different learned model. Slightly perturbing the data fed into a learned model may give completely incorrect results. Ideally, given a set of data, it would be reassuring to converge on the same model regardless of the order of training, and imperceptible perturbations in inputs should not cause extreme changes in outputs.
- Predictive power and bounding errors: A learned model may give one the ability to predict—at least within the domain of data on which the model was trained, which is akin to interpolation. How well will the model do outside of this range (extrapolation) on input data it has never seen before? What can be said a priori and/or a posteriori about the expected error (uncertainty) in the prediction? Furthermore, can we gain understanding from the learned model? Prediction and understanding are not the same thing, and science is about seeing the commonalities in functional behavior and formulating new hypothesis and theories.
- Physical constraints: We already know many physical principles (e.g. conservation laws). How do we include existing knowledge into our ML process? How do we do so without biasing the results, which could mask true scientific discovery? How do we know when the data may not have more information content than what we already know, i.e., we are training on noise?
These are just a few of the areas that demand exciting new research, and where CASC must and will work with the scientific community to lead the way. We must place ML and AI on a firm theoretical foundation, much the way numerical analysis has put simulation on a firm theoretical foundation that is continuously improved. If you were to go back to the early days of numerical simulation, similar types of issues were open questions: When will this discretization or solver work? How do I know the scheme is accurate? Stable? Convergent?
Now is the time to address these questions about ML and AI, before the hype gets out too far ahead and tastes sour on the prospects for robust funding.
Contact: Jeff Hittinger
Advancing the Discipline | Opening the Black Box of Data Driven Models

While data driven models have led to unprecedented advances in a wide variety of application areas their black box nature is creating new challenges. Deep neural networks have allowed us to create complex multi-modal models in areas such as high energy density physics, biology, and natural language processing. However, interpreting the results or understanding whether a given model has adequately converged is difficult. As mentioned in a recent Science & Technology Review issue, a team of CASC researchers is working on techniques to open this black box and providing new insights into both the training process as well as the model itself. In particular, researchers are using high-dimensional visualization coupled with topological data analysis to allow an interactive exploration of both the fitted response (e.g., the yield of a NIF implosion) and the error surface of various loss functions used to fit the model.
As part of the Cognitive Computing Strategic Initiative LDRD, the team is applying these techniques to help design, debug, and interpret a complex multi-modal surrogate model aimed at emulating simulations of NIF (National Ignition Facility) shots. The model maps a five-dimensional parameter space into a set of scalars and images describing the output of the simulation. However, the model itself uses a number of different loss functions each aimed at different aspects of the fitting.
One particular challenge was the traditional approach of judging a model by its global error which tends to obscure outliers and provides little insight into the underlying behavior. In this example, multiple models at different sample sizes (100K, 1M, and 10M samples) were fit all showing a well-converged global error. However, high-dimensional topology made it possible to directly analyze and visualize the different loss surfaces defined over the five-dimensional input space providing insights into the local behavior of the errors. This demonstrated that the model fitted on only 100K samples did not in fact converge but had multiple, albeit small, regions in parameter space with abnormally high error.
Similarly, even the initial large model demonstrated individual outliers in the data that could not be fitted within the standard training process. These were ultimately deemed artifacts of the data production that could not have been found using global techniques. Furthermore, the process of analyzing loss functions in a detailed localized manner uncovered a number of errors in the training algorithm and data selection code. In summary, the ability to analyze and visualize the local behavior of high-dimensional black box models has proven a crucial component of developing, debugging, and validating such models.
For more information see a recent issue of LLNL's S&TR magazine.
Contacts: Shusen Liu, Peer-Timo Bremer
Lab Impact | Autonomous Vehicle Operations in Future Networked Smart Highways with Heavy Vehicle Platooning Research
Since the late 1990’s, LLNL has played a significant role in improving the fuel economy of class-8 heavy vehicles through enhanced aerodynamics. The majority of the aerodynamic drag reduction devices seen on the road today, such as trailer skirts and boattails, are based upon designs that were either initiated or tested by LLNL and its collaborators at several universities, national laboratories, NASA, and commercial manufacturers. For example, LLNL researchers Kambiz Salari (CASC) and Jason Ortega have developed an integrated highly aerodynamic heavy vehicle shape that has a drag coefficient 80% smaller than that of heavy vehicles on the road today.
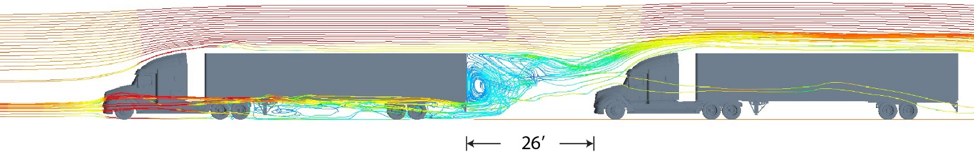
Most recently, they are looking into the aerodynamic/fuel economy benefits of heavy vehicle platoons—defined as closely following vehicles at highway speeds (see Figure 1). Such platoons could have a significant impact upon the United States’ petroleum usage since more than 80% of all freight is transported by semi-tractor trailers.[1] Although these class-8 heavy vehicles comprise just 4% of on-road vehicles, their diesel engines consume more than 14% of all on-road vehicle fuel use due to their relatively poor average fuel economy of 5.8 mpg.[1-2] Given the prediction that conventional diesel engines will power more than 70% of all class-8 vehicles in the United States by 2050, there is a rapidly growing interest for improving the fuel economy and freight efficiency of the trucking industry, both of which can benefit from heavy vehicles platoons.[3]
Since the vehicle spacings required for the maximum aerodynamic advantage of platooning are much too small for drivers to safely react to sudden changes in driving conditions, the real-world implementation of platoons must rely upon some form of a driver-assisted control system. While this would not have been possible in the past, recent advancements in adaptive cruise control systems, collision mitigation sensors, radar-based active braking, and vehicle-to-vehicle communication (V2V) systems have made platooning a viable means of vehicle operation.
To elucidate the underlying flow physics that produce the aerodynamic/fuel economy benefits from heavy vehicle platooning at these close spacings, several studies have been conducted in recent years and have demonstrated that 30’ to 50’ spacings (less than one vehicle length) between the leading and following vehicles produce up to 8% fuel savings for the platoon.[2-6] Furthermore, the installation of trailer aerodynamic drag reduction devices (trailer boattails and skirts) can produce an additional fuel savings up to 14%. While even greater aerodynamic benefits can potentially be achieved from smaller spacings between the lead and following vehicles, these benefits are often obscured by increased operation of the engine cooling fan in the trailing vehicle, which must run more than normal due to reduced cooling airflow. For example, at a spacing ranging from 20’ to 50’, track tests of a two-vehicle platoon indicated that the fuel savings for the trailing vehicle actually decreased as the vehicles drove more closely together due to increased engine cooling fan-on time.[7-8]
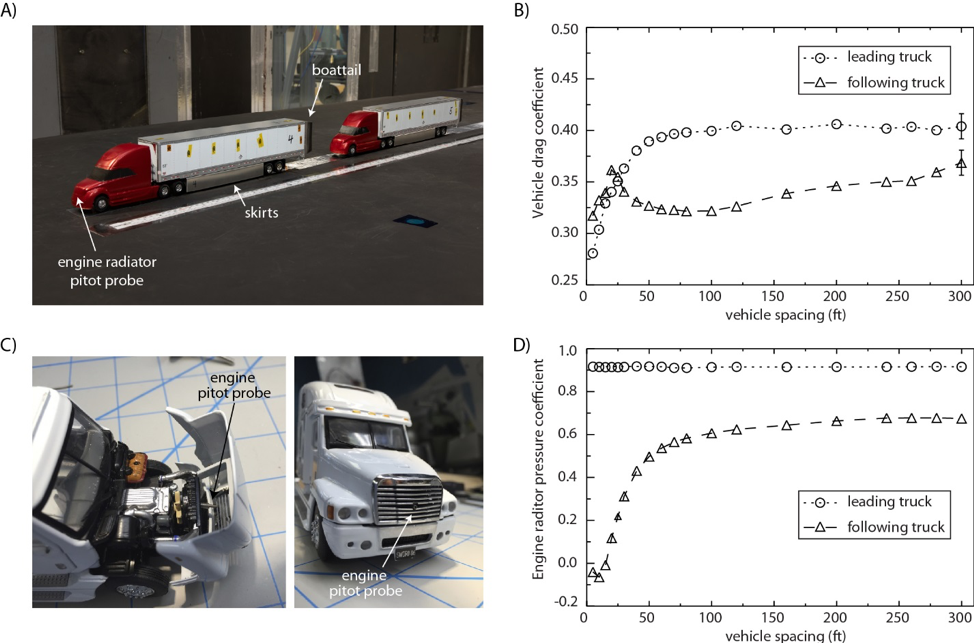
Recent wind tunnel tests conducted by LLNL researchers at the NASA Ames 7x10 wind tunnel confirmed these phenomena in a 50th scale platooning test (Figure 2A). At this smaller vehicle scale, it is possible to make measurements for spacings ranging from 5’ to 300’ with multiple vehicles, which is difficult to accomplish in full-scale track testing. As the spacing between the two vehicles was reduced, the aerodynamic benefit improved with drag reductions present on both the leading and following vehicles (Figure 2B). However, the pressure coefficient at the engine radiator of the following vehicle, which was measured with an internal pitot probe, demonstrated a significant decrease as the vehicles came closer together, indicating the loss of cooling flow to the following vehicle as seen in the full-scale tests (Figure 2C-D). This clearly demonstrates that an optimum platoon spacing must be found in which not only the aerodynamic drag is minimized, but also the engine cooling flow for the following vehicle is maximized.
Several companies, including Daimler, Volvo, Navistar, Telsa, and Peloton, are continuing to develop platooning control systems for heavy vehicles. Implementing this technology nationwide can potentially reduce annual CO2 emissions by 15.3 million metric tons and heavy vehicle energy use by approximately 4.2%, corresponding to an estimated savings of $726 billion each year throughout the United States’ trucking industry.[8] Looking even farther ahead, many envision a future in which individual platoons are coupled through networked smart highways to provide even greater fuel economy improvements by readily accommodating autonomous passenger vehicles that can either join existing heavy vehicle platoons or form new platoons as the vehicles travel to their different destinations throughout the country.
References
[1] Brogan, J.J., Aeppli, A.E., Beagan, D.F, Brown, A., Fischer, M.J., Grenzeback, L.R., McKenzie, E., Vimmerstedt, L., Vyas, A.D., Witzke, E., Freight Transportation Modal Shares: Scenarios for a Low-Carbon Future, Transportation Energy Futures Series. Prepared by Cambridge Systematics, Inc. (Cambridge, MA) and the National Renewable Energy Laboratory for the U.S. Department of Energy, Washington, DC, 2013.
[2] Gravel, R., SuperTruck–An Opportunity to Reduce GHG Emissions while Meeting Service Demands, Conference on Climate Policy in an Energy Boom, Pacific Grove, California August 6–9, 2013.
[3] Askin, A.C., Barter, G.E., West, T.H., Manley, D.K., The Heavy-Duty Vehicle Future in the United States: A Parametric Analysis of Technology and Policy Tradeoffs, Energy Policy, 81:1–13, 2015.
[4] Tsugawa, S., Jeschke, S., and Shladover, S.E., A Review of Truck Platooning Projects for Energy Savings, IEEE Transactions on Intelligent Vehicles, 1:68-77, 2016.
[5] Trucking Efficiency Confidence Report: Two-Truck Platooning, North American Council for Freight Efficiency, 2016.
[6] Gaudet, B., Review of Cooperative Truck Platooning Systems, National Research Council Canada, Technical Report, ST-GV-TR-0011, 2014.
[7] Lammert M.P., Duran, A., Diez J., Burton, K., Nicholson, A., Effect of Platooning on Fuel Consumption of Class 8 Vehicles over a Range of Speeds, Following Distances, and Mass, SAE Int. J. Commer. Veh., 7:626-639, 2014.
[8] Muratori, M., Holden, J., Lammert, M., Duran, A., Young, S., Gonder, J., Potentials for Platooning in U.S. Highway Freight Transport, National Renewable Energy Laboratory, NREL/CP-5400-67618, 2017.
Contact: Kambiz Salari
Collaborations | Debugging Interface Officially Became Part of the OpenMP Standard 5.0
Version 5.0 of the OpenMP API Specification, which was released in November shortly before SC18, marks a major milestone in 21 years of OpenMP history. The OpenMP API Version 5.0 features many significant additions to the specification—some of the major features were described in CASC Newsletter #5. Several LLNL staff members played a central role in the development of OpenMP 5.0, including Bronis de Supinski (Livermore Computing Chief Technology Officer and Chair of the OpenMP Language Committee), CASC members Tom Scogland and Ignacio Laguna, and Livermore Computing (LC) staff Dong Ahn and Marty McFadden.
As OpenMP becomes more sophisticated in supporting more programming abstractions, the ability to enable better external tool interfaces becomes increasingly important. A significant new feature in the Standard is the addition of OMPD, an interface that greatly facilitates the implementation of portable debugging tools. CASC researcher Ignacio Laguna spearheaded the effort to design and adopt OMPD, with critical contributions from McFadden and Ahn.
The design and proof of concept of OMPD involved a co-design effort of many years of work and several organizations, such as Rogue Wave Software (developers of the TotalView debugger), RWTH Aachen University, Rice University, and IBM, to ensure that this interface meets the requirements that are important for LLNL.
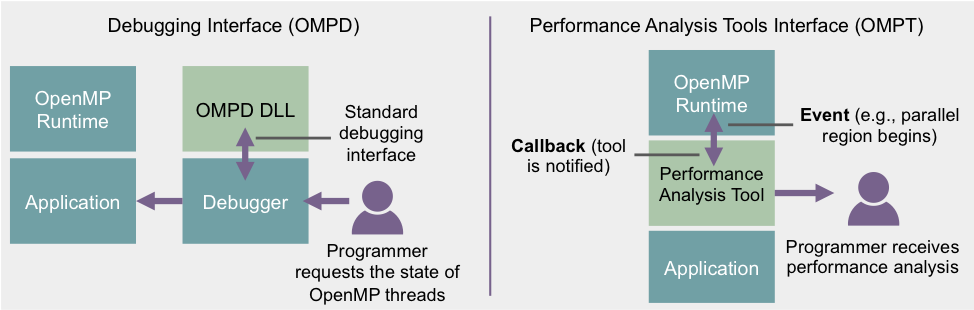
For previous versions of the OpenMP specification, debuggers implemented ad-hoc mechanisms to understand the state of an OpenMP program, such as the state of threads and parallel regions. These mechanisms were not portable across OpenMP implementations, so a new standard interface was needed to enable cross-implementations debugging support. OMPD now provides high-level abstractions that allow a debugger to understand the state of an OpenMP program in an implementation-independent manner. For any OpenMP implementation, a debugger is now able to use a dynamically loaded library (DLL) to interrogate the state of OpenMP, rather than trying to decipher the details of the implementation to obtain the state. The DLL method was originally proposed in 2003 in a paper by the implementers of TotalView and LLNL staff members[1]. The technique has evolved through the effort to standardize the interface to support advanced features such as accelerators.
OMPD enables several important debugging use cases, such as understanding the state of OpenMP threads and placing breakpoints before and after a parallel region. A prototype implementation of the OMPD interface for the Clang/LLVM compiler, and effort led by Ignacio Laguna and LC staff members, is being tested in the TotalView debugger (Rogue Wave), gdb, and cuda-gdb debuggers.
The new OpenMP specification also provides OMPT, an interface that allows performance tools to monitor OpenMP state dynamically. A number of performance analysis tools have already adopted OMPT, including Tau and HPCToolkit. Several LLNL staff members contributed to the design of OMPT, including Bronis de Supinski who led an effort to have the OpenMP Architecture Review Board adopt a first-party interface (an experience that subsequently shaped LLNL’s strategy to have OMPT and OMPD included in the full OpenMP specification), and Martin Schulz (formerly CASC), who led the OpenMP Language Committee’s Tools Subcommittee before he joined the Technical University of Munich.
We fully expect that both OMPD and OMPT will enhance the support for performance, debugging and code-correctness tools for OpenMP, leading to a more capable tools ecosystem for future HPC systems.
References
[1] Cownie, James, John DelSignore, Bronis R. de Supinski, and Karen Warren. "DMPL: an OpenMP DLL debugging interface." In International Workshop on OpenMP Applications and Tools, pp. 137-146. Springer, Berlin, Heidelberg, 2003.
Contact: Ignacio Laguna
CASC Highlights
New Postdocs
- Bo "Ivy" Peng
- Stephanie Brink
- Ben Priest
- Stefanie Guenther
- Socratis Petrides
- Julien Andrej
- Victor Paludetto Magri
- Avary Kolasinski
- Sarah Mousley
- Jize Zhang
- Dan Milroy
New Staff
- Chak Shing Lee
- Chris Vogl
- Daniel Merl
- Shusen Liu
- Brian Weston
Looking Back: CASC in 1997
For this issue, we dug into the archives for a little bit of fun history. Back in 1997, CASC was still a rapidly growing organization that was formed during the early days of ASCI (the Accelerated Scientific Computing Initiative) and the decision to move the NERSC (National Energy Research Scientific Computing) from LLNL to Lawrence Berkeley 30 miles to the west.
CASC celebrated its 20th anniversary back in 2016, and continues to lead the lab into new frontiers in computational mathematics, computer science, and data science. The description of CASC in this article still largely holds true to this day:
One Year and Counting for CASC
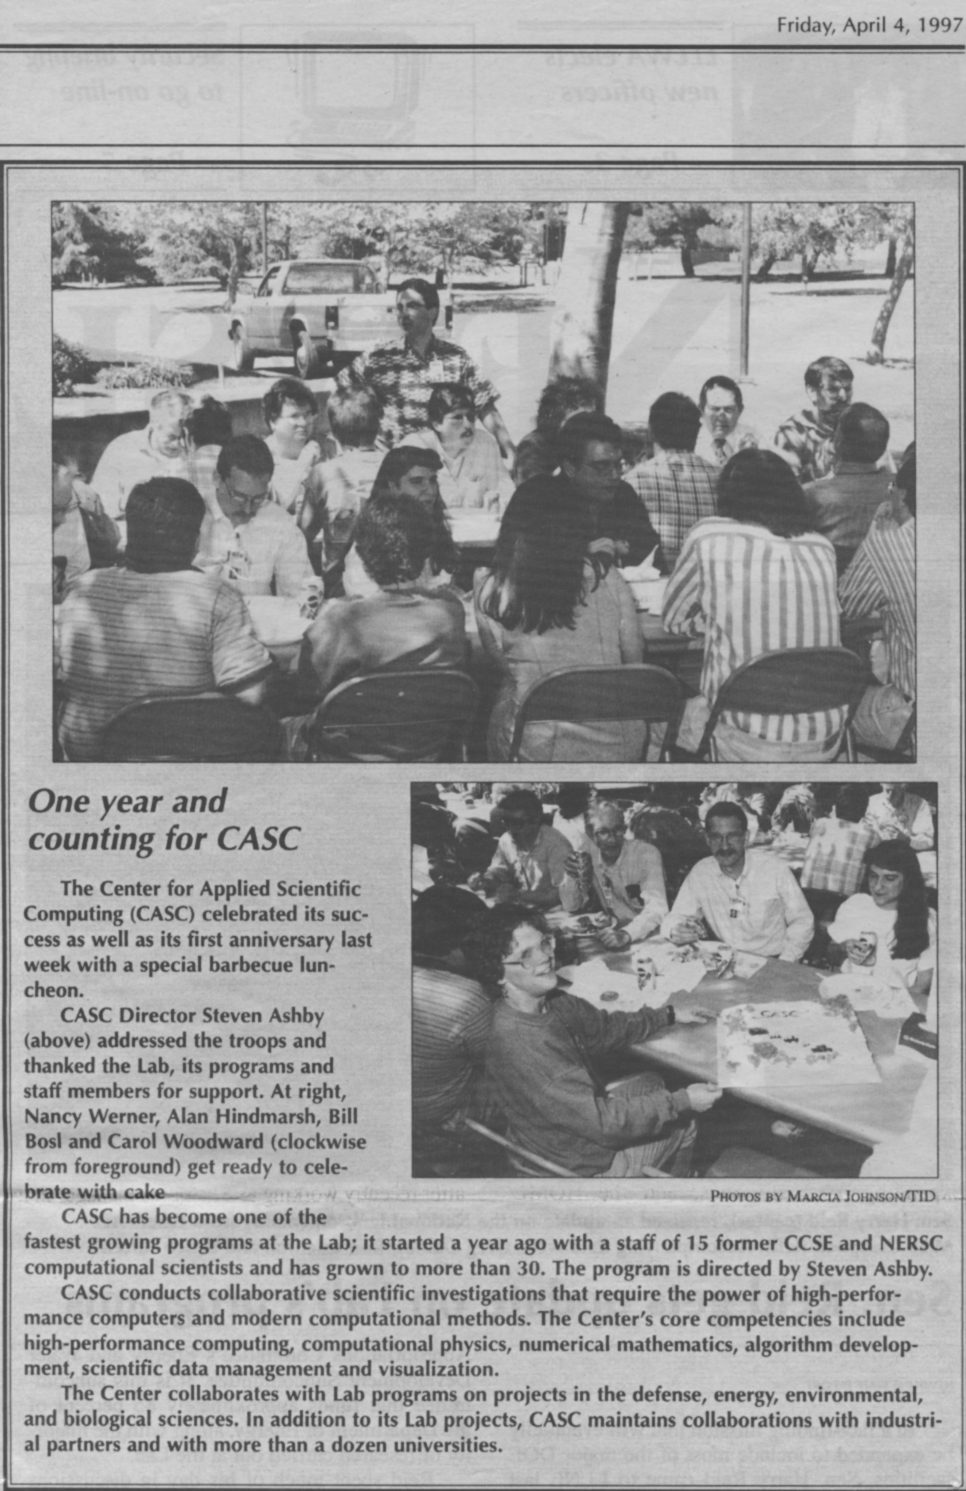
The Center for Applied Scientific computing (CASC) celebrated its success as well as its first anniversary last week with a special barbecue luncheon.
CASC Director Steven Ashby addressed the troops and thanked the Lab, its programs and staff members for support. At right, Nancy Werner, Alan Hindmarsh, Bill Bosl and Carol Woodward (clockwise from foreground) get ready to celebrate with cake.
CASC has become one of the fastest growing programs at the Lab; it started a year ago with a staff of 15 former CCSE and NERSC computational scientists and has grown to more than 30. The program is directed by Steven Ashby.
CASC conducts collaborative scientific investigations that require the power of high performance computers and modern computational methods. The Center's core competencies include high performance computing, computational physics, numerical mathematics, algorithm development, scientific data management and visualization.
The Center collaborates with Lab programs on projects in the defense, energy, environmental, and biological sciences. In additional to its Lab projects, CASC maintains collaborations with industrial partners and more than a dozen universities.
CASC Newsletter Sign-up
Was this newsletter link passed along to you? Or did you happen to find it on social media? Sign up to be notified of future newsletters, which we release approximately every 3 months.
LLNL-WEB-785641