
Disclaimer: This article is more than two years old. Developments in science and computing happen quickly, and more up-to-date resources on this topic may be available.
An enduring question in machine learning (ML) concerns performance: How do we know if a model produces reliable results? The best models have explainable logic and can withstand data perturbations, but performance analysis tools and datasets that will help researchers meaningfully evaluate these models are scarce.
A team from LLNL’s Center for Applied Scientific Computing (CASC) is teasing apart performance measurements of ML-based neural image compression (NIC) models to inform real-world adoption. NIC models use ML algorithms to convert image data into numerical representations, providing lightweight data transmission in low-bandwidth scenarios. For example, a drone with limited battery power and storage must send compressed data to the operator without destroying or losing any important information.
CASC researchers James Diffenderfer and Bhavya Kailkhura, with collaborators from Duke University and Thomson Reuters Labs, co-authored a paper investigating the robustness of NIC methods. The research was accepted to the 2023 Conference on Neural Information Processing Systems (NeurIPS), held December 10–16 in New Orleans. Founded in 1987, the conference is one of the top annual events in ML and computer vision research.
Expecting the Unexpected
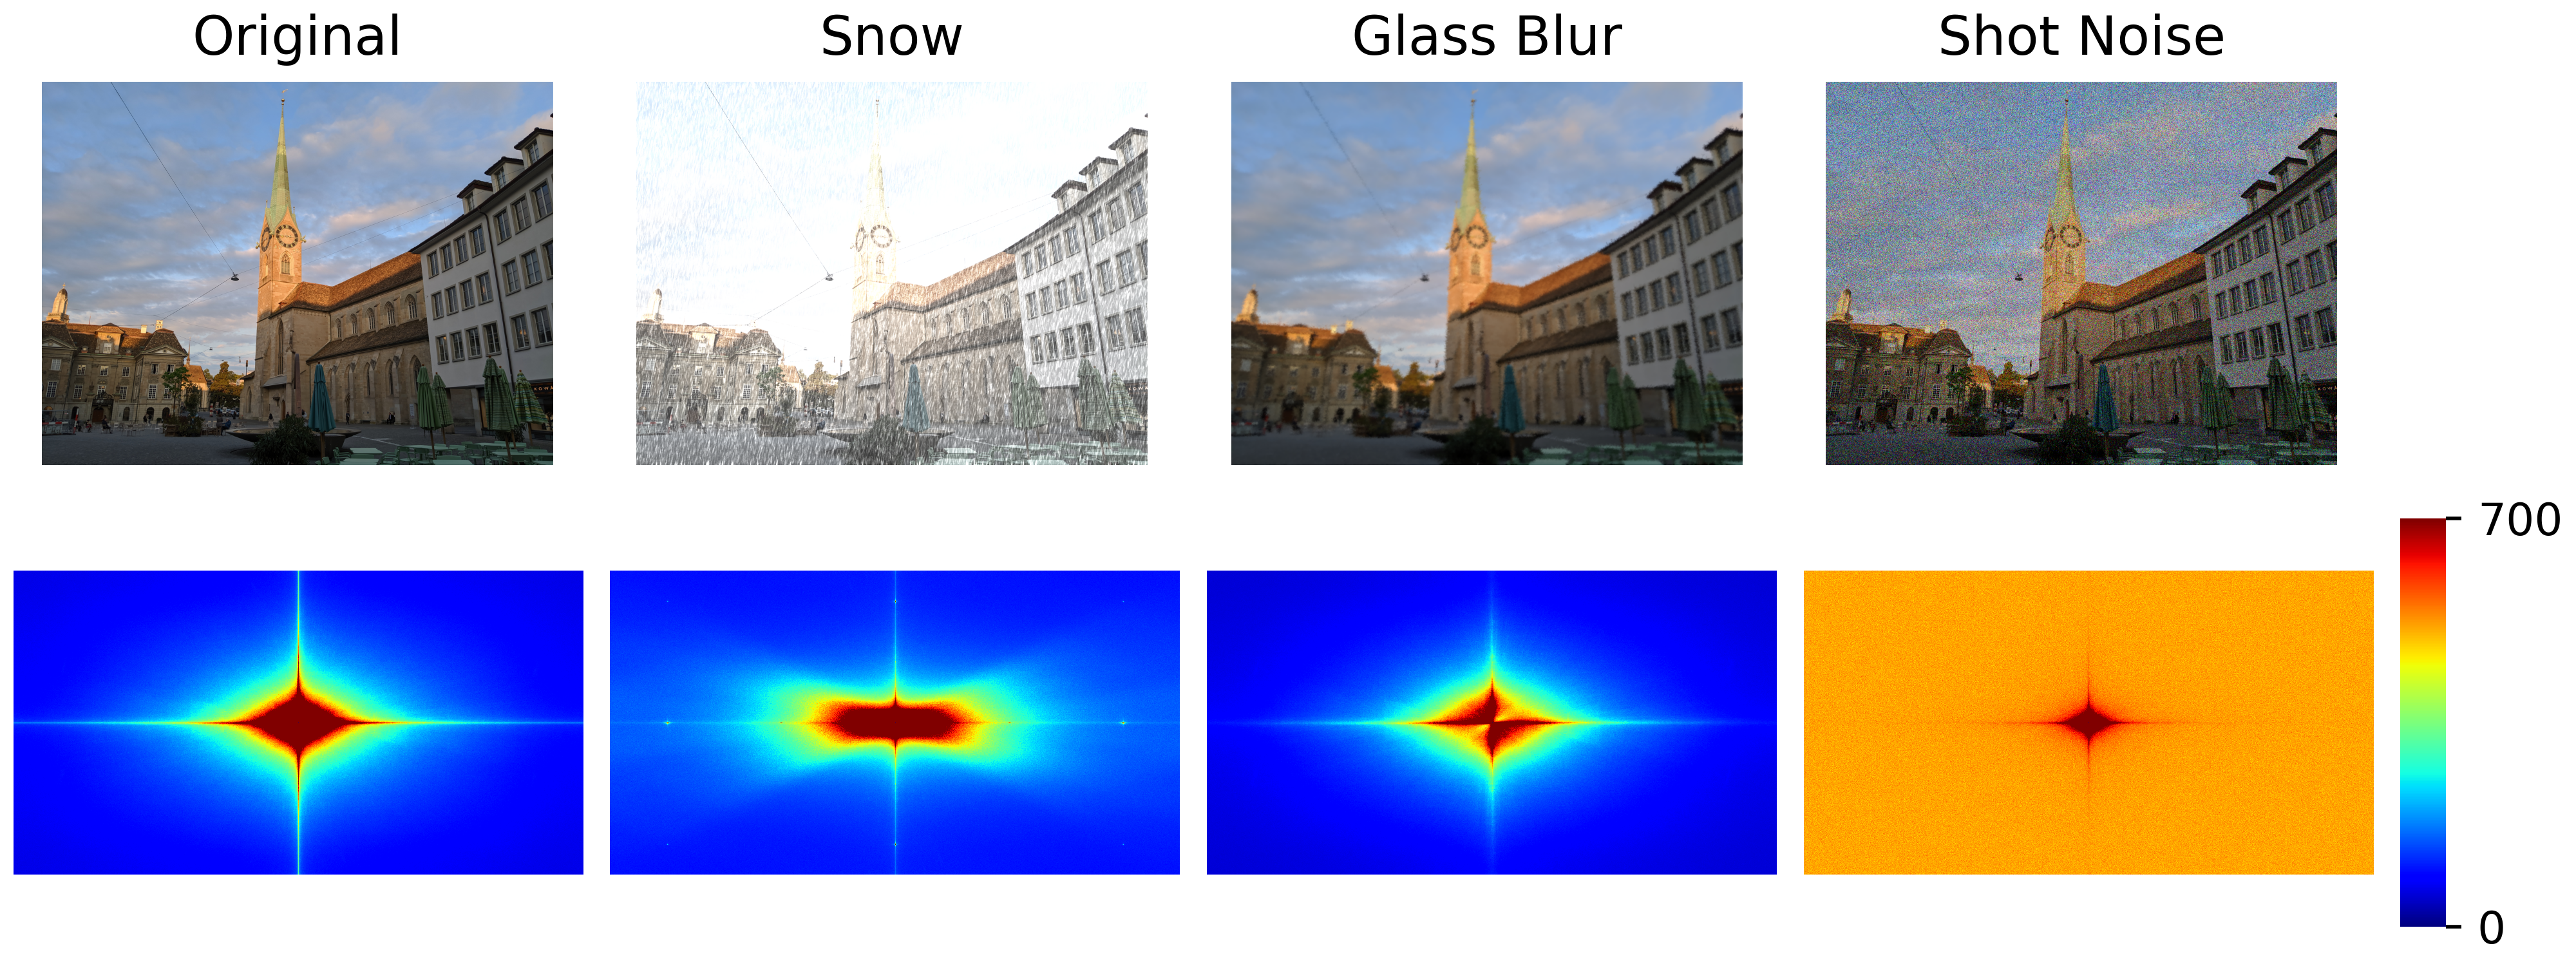
ML techniques like neural networks have gained popularity in image compression schemes. Performance evaluation in this context typically emphasizes the rate distortion of pixels, but pixel-based analysis cannot stand up to new, unforeseen data encountered outside a model’s training dataset. For instance, images collected during a rainstorm are out-of-distribution (OOD) data for a drone trained on sunny-sky images; likewise for images of trees when the training dataset consists of animals.
“NIC methods need to be robust against OOD data, but existing metrics don’t tell us whether a given method is reliable in that case,” Diffenderfer explains. “We found that compression methods behaved differently when we looked at the spectral frequency of distribution shifts that occur between the training and OOD test datasets.” The team’s paper details the spectral inspection tools they developed as well as the empirical application of those tools on datasets with distributional shifts.
A Spectrum of Understanding
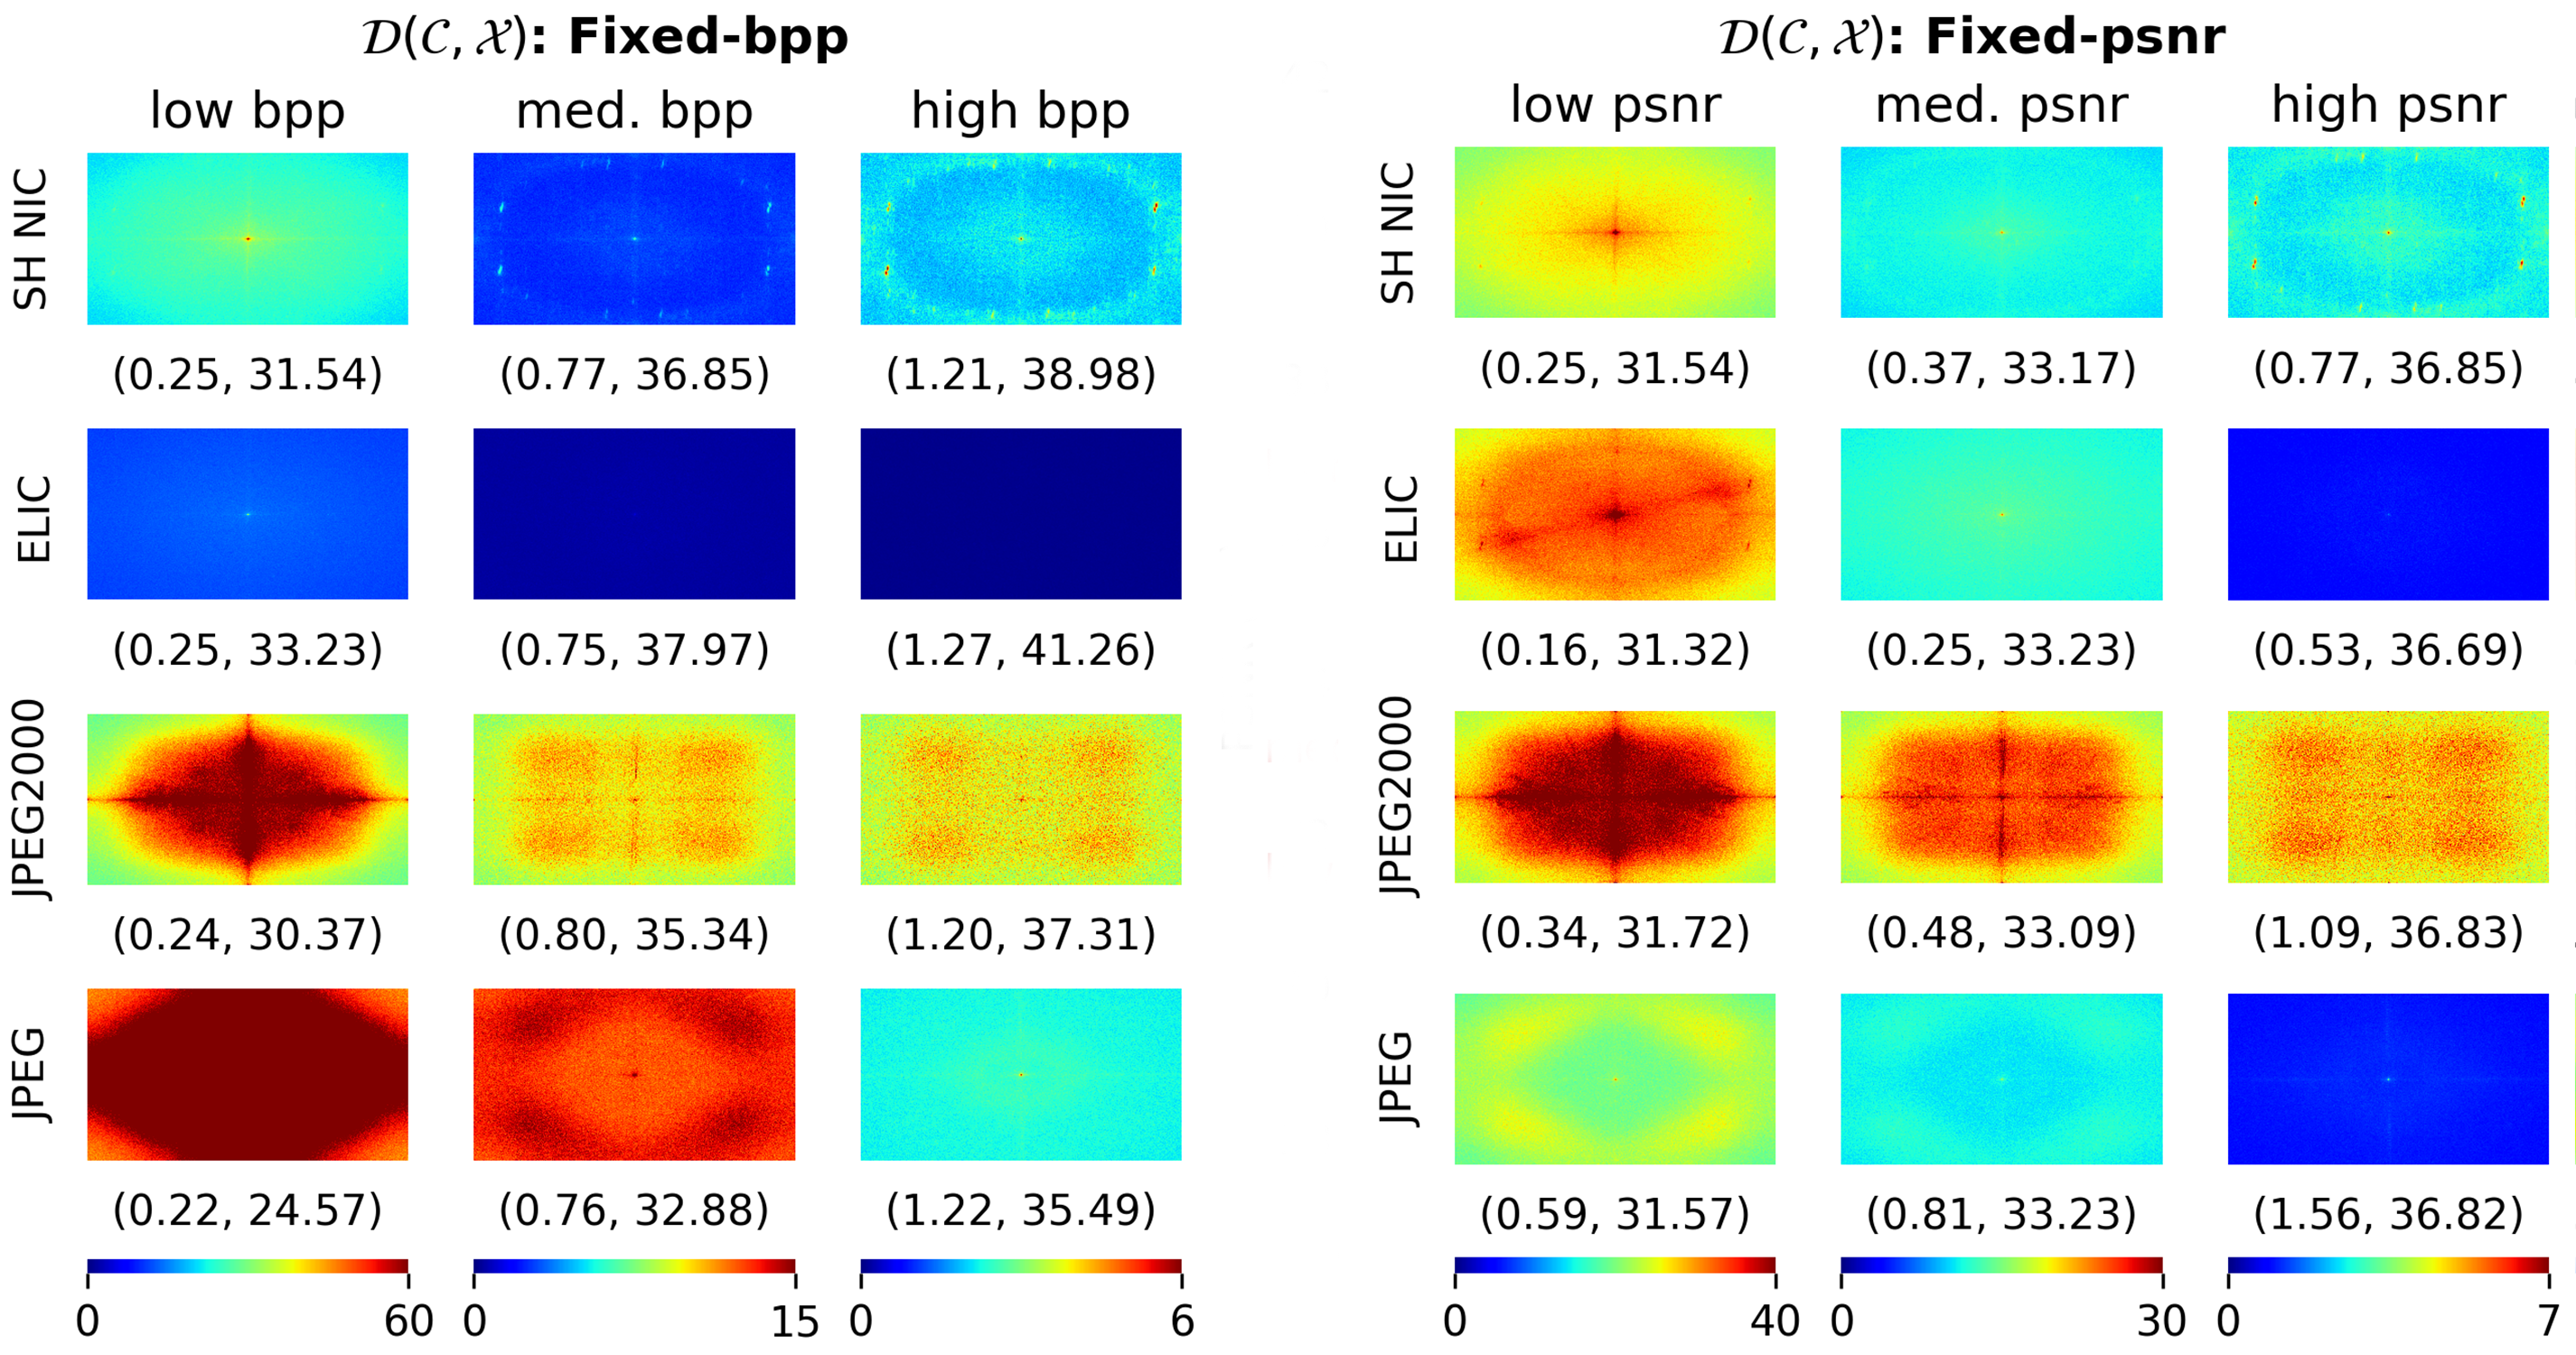
Spectral analysis reveals a more nuanced performance landscape for NIC models. For instance, the researchers discovered that models prioritize different parts of the frequency spectrum as the compression rate increases. Diffenderfer notes, “Some models do better with OOD data when facing low- or medium-frequency shifts compared to high frequency. Some models preserve the perturbations found in OOD data better than they denoise them, and vice versa.”
The team evaluated various NIC models by comparing performance on both in-distribution and OOD data. They augmented publicly available datasets with 15 image corruptions at diverse severity levels—effectively creating new datasets as benchmarks for NIC testing. The researchers then determined the amount of error each method introduced and visualized the results via spectral heatmaps. Considered across multiple frequency domains, these results offer NIC performance information not available from traditional metrics.
This depth of understanding is a crucial step forward in improving NIC for a range of uses. “To the best of our knowledge, no one has studied NIC methods in this way before,” Diffenderfer points out. “It’s important to understand where these models are vulnerable or make mistakes in risky or dangerous scenarios. This type of analysis matters not just in image compression, but even with large language and computer vision models. Robustness is a concern everywhere.”
—Holly Auten