
Modern HPC applications consist of a complex network of physics packages, numerical solvers, and support libraries and are running on an increasingly complex HPC ecosystem, so a comprehensive understanding of performance behavior is crucial. Application developers must have tools that can compile, analyze, and compare measurements and contexts from many independent sources. While the HPC community has developed a number of tools for performance measurement, data collection, and analysis, these may be geared towards specific types of analyses or maintain only limited and specialized contextual information.
Caliper+Thicket provides ubiquitous HPC performance analysis, enabling a practical shift in performance engineering from occasional expert-driven profiling to continuous, routine performance monitoring and analysis that the entire development team can use. By embedding low-overhead annotations and measurement capability directly into applications, this solution makes performance data collection easy to enable in production runs and automated workflows for nightly test runs, directly improving detection of regressions and validation of performance across changing codebases and hardware platforms.
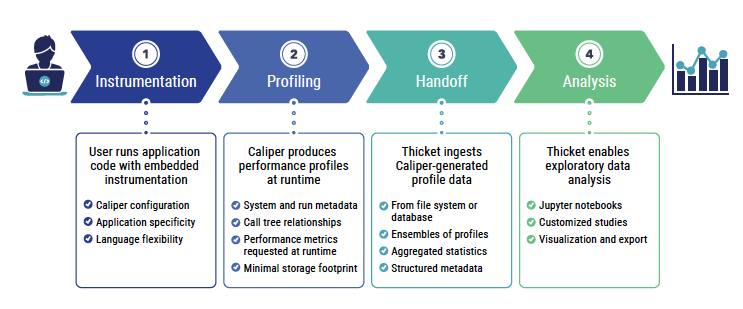
This mature, integrated solution combines Caliper’s instrumentation and runtime-controlled measurement approach with Thicket’s ability to programmatically analyze large collections of performance profiles in a scalable way. Together these components address the major barriers—complex setup, difficulty comparing large ensembles of data—that have limited performance measurement as a routine workflow. Caliper+Thicket is utilized in practice, with real-world success stories of collecting performance data and identifying bottlenecks in the code. Extensive documentation and tutorial materials are available online (see sidebar).
Flexible Instrumentation with Caliper
Caliper makes performance introspection tasks easier by acting as the “glue” that connects various independent context annotations, measurement services, and data processing services. As both a flexible model for representing performance-related data and a transparent library for combining performance metrics and program context information, Caliper enables users to build customized performance measurement and analysis solutions. Caliper adapts to a range of use cases—whether standalone or integrated with third-party tools—thanks to its modular architecture, and instrumentation APIs are available for codes written in C, C++, Fortran, or Python.
Caliper enables comprehensive performance profiling with these key features:
- Low-overhead source-code annotation API
- Configuration API for performance measurements within an application
- Recording program metadata for analyzing collections of runs
- Application-specific features captured for performance analysis
- Online and offline data aggregation
- Measurement and profiling functionality (e.g., timers, events)
- Memory-allocation annotations
Multi-Dimensional Analysis with Thicket
Although many HPC performance tools focus on a single aspect of application execution, Thicket manages multi-dimensional analysis across scales, computing architectures, and profiling tools. Its modular structure relies on call trees, metadata, and dimensionality reduction to aid in exploratory data analysis and decision making. For example, a developer may extract performance data associated with specific kernels in order to determine an appropriate baseline or optimization level. Users can generate statistical models as well as customize and export performance data.
Thicket lowers the barrier to performance optimization with these key features:
- Unification of data collected from multiple sources across ensembles of application runs
- Comprehensive interface and interactivity via Jupyter notebooks
- Support for different types of visualization outputs
- Built-in aggregated statistical models for quick introspection
- Preservation of execution context and metadata
- Portability across processors, clusters, and cloud resources