The HAC model
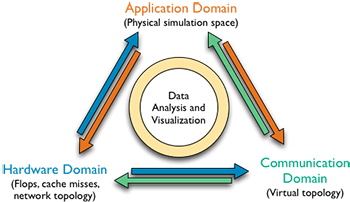
The HAC model identifies three key domains for performance measurements and defines projections between them. The figure on the right illustrates this approach: we gather data in each of the three domains in the form of application data, performance metrics and communication profiles, and we define projections of this data to the other two. This not only allows us to directly compare the data across domains, but also opens the door to using data visualization and analysis tools available in the other domains. We can now apply scientific visualization tools to performance data projected into the application domain, or we can apply graph-based techniques to the same data projected into the communication domain. The HAC model provides a structured characterization of common performance analysis and optimization challenges in terms of relevant source data/domains, the necessary mappings, and the subsequent analysis requirements. This structure can lead to new insights, more focused research directions, and a common framework to describe, compare, and combine different approaches.
Application Domain
The application domain represents the physical or other simulated system modeled by an application code. Often it is a piece of physical space with materials represented by some grid or mesh, but more abstract domains such as sparse matrices or large, abstract graphs are also possible. This is the domain most familiar to scientists, and it generally provides the mental reference frame during the code design stage. The application is ideal for exploring performance problems related to specific physical phenomena of the simulation. Once we map the data into this space, we can exploit the large number of scientific visualization and analysis tools that already exist for application data.
Hardware Domain
The hardware domain describes the physical hardware of a computer system in terms of computing cores and network links. Data analysis in the hardware domain poses several challenges. Clearly, large scale graph algorithms such as clustering can be helpful. However, many of the largest supercomputers use regular grids connected into three-dimensional tori. Future machines will use higher-dimensional mesh/torus topologies. Given the large number of nodes and the cartesian scaling properties, it is reasonable at scale to treat such a regular grid as a discrete representation of a continuous space. This allows the use of new classes of algorithms such as local correlation analysis or topological techniques to detect and extract features from high dimensional manifolds.
Communication Domain
The communication domain consists of a general graph. For MPI programs, such as the ones studied here, nodes correspond to MPI processes and edges correspond to message exchanges between them. During execution, most MPI applications will exhibit multiple distinct communication patterns. The projections of the communication patterns on to the hardware domain can provide useful insights into the efficiency of the communication phases in an application.

