
Disclaimer: This article is more than two years old. Developments in science and computing happen quickly, and more up-to-date resources on this topic may be available.
A research team from LLNL’s Center for Applied Scientific Computing (CASC) won Best Paper at the 15th IEEE Pacific Visualization Symposium (PacificVis), which was held virtually on April 11–14. Computer scientists Harsh Bhatia, Peer-Timo Bremer, and Peter Lindstrom collaborated with University of Utah colleagues Duong Hoang, Nate Morrical, and Valerio Pascucci on “AMM: Adaptive Multilinear Meshes” (see the PDF and GitHub repository).
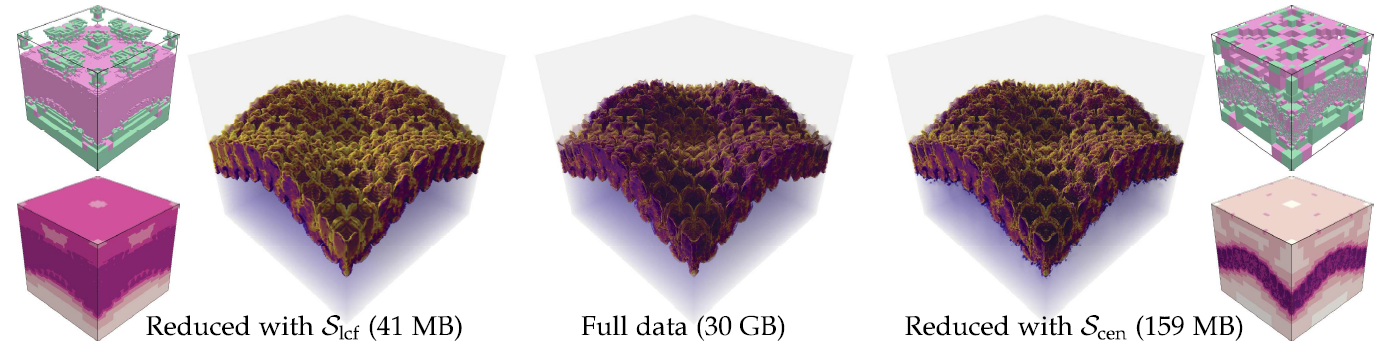
AMM provides users with a resolution-precision-adaptive representation technique that reduces mesh sizes, thereby reducing the memory and storage footprints of large scientific datasets. The approach combines two solutions into one—reducing data precision and adapting data resolution—to improve the performance and efficiency of data processing and visualization. A key novelty in AMM is that it lets users compare different data-reduction strategies to determine which would work best for a specific dataset.
PacificVis is among the leading international conferences in visualization research. Bhatia, the paper’s lead author, points out, “AMM is the result of a lot of hard work. Publishing our work and releasing our code as open source are ways to engage with others in this field, and it’s an honor to be acknowledged.” Bremer adds, “This was another great example of Livermore’s team-based approach enabled by strategic internal investments. AMM was conceived as part of the Variable Precision Computing [VPC] project, which assembled a large interdisciplinary team that ultimately led to this success.”
Lindstrom notes that resolution and precision—respectively analogous to the number of dots per inch and the number of colors that can be displayed on a computer monitor—have previously been treated separately. He states, “Our AMM framework allows the two quantities to be optimized together for a given data analysis task in order to significantly reduce data volumes without compromising the accuracy of scientific conclusions.”
The award-winning paper marks another successful collaboration between LLNL and the University of Utah. “Our institutions share an interest in high-dimensional data analysis, topology, and visualization. The relationship has been mutually beneficial,” says Bremer, who serves part-time as Associate Director for Research at the university’s Center for Extreme Data Management Analysis and Visualization (CEDMAV). Co-author Hoang, a PhD student, worked as a Lab intern on data representations for large-scale reduction, while Bhatia, a former Lawrence Graduate Scholar, earned his PhD in 2014 under the guidance of co-author Pascucci.
Two Solutions in One
As Bremer notes above, the idea for AMM arose from the VPC project, which was led by Hittinger and funded by the Laboratory Directed Research and Development program. The VPC team focused on data-reduction algorithms that more efficiently preserved information encoded in data. Reducing large-scale data makes it easier to process and decreases its movement between memory processors and compute nodes.
Data reduction typically happens via sophisticated compression or spatial resolution techniques. Bhatia states, “We asked ourselves what would happen if we were to combine these solutions to achieve the best of both worlds. In previous papers within the same research effort, we showed that combining the two approaches offer significant gains. The challenge for AMM became how to maintain such representations in-memory.”
The AMM representation combines the strengths of both data-reduction methods and improves them to deliver a new type of representation. With respect to resolution adaptivity, instead of representing data in typical cube-shaped cells, the team discovered a more flexible spatial arrangement in rectangular cuboidal cells—an approach that minimizes the number of necessary cells and vertices and draws on Lindstrom’s prior research in adaptive data representation.
In the context of precision adaptivity, a program normally un-compresses compressed data and converts it into representations that can be processed easily (e.g., extracting a zip file’s contents). However, Bhatia explains, “By combining the ideas from compressed representations and spatial hierarchies, AMM offers a different way of representing data that can construct and maintain data approximations directly in-memory where users can access them more quickly.”
Incremental Updates
AMM processes and updates these representations incrementally, reducing large datasets piece by piece. Isolating regions of interest without all of the surrounding information helps minimize the size of the representation. Bhatia evokes a camera analogy: “When you look at data from a particular camera angle, you don’t need to process what’s not in view. However, as you move the camera to look at a different part of the data, other portions of the data need to be processed, and the reduction scheme should adapt to the changes.” Incremental updates in AMM allow the user to control where to refine the data based on their needs or reduction strategies.
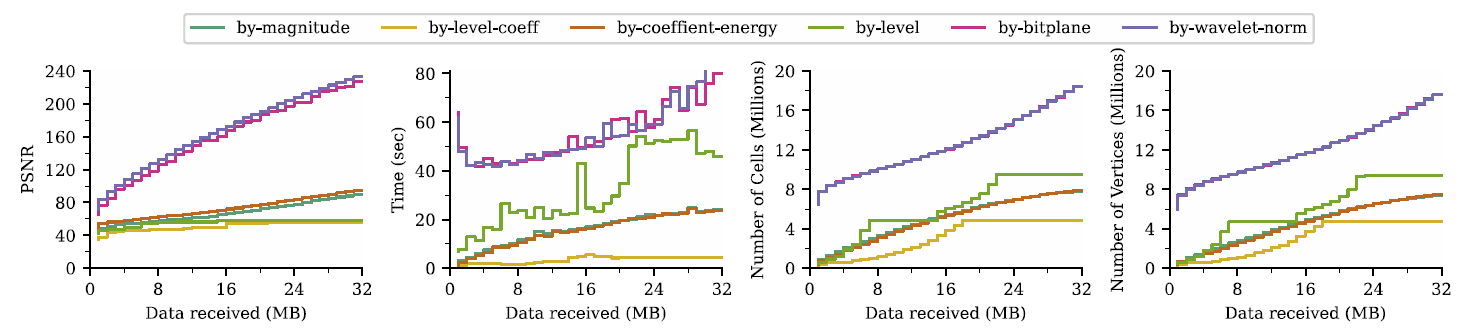
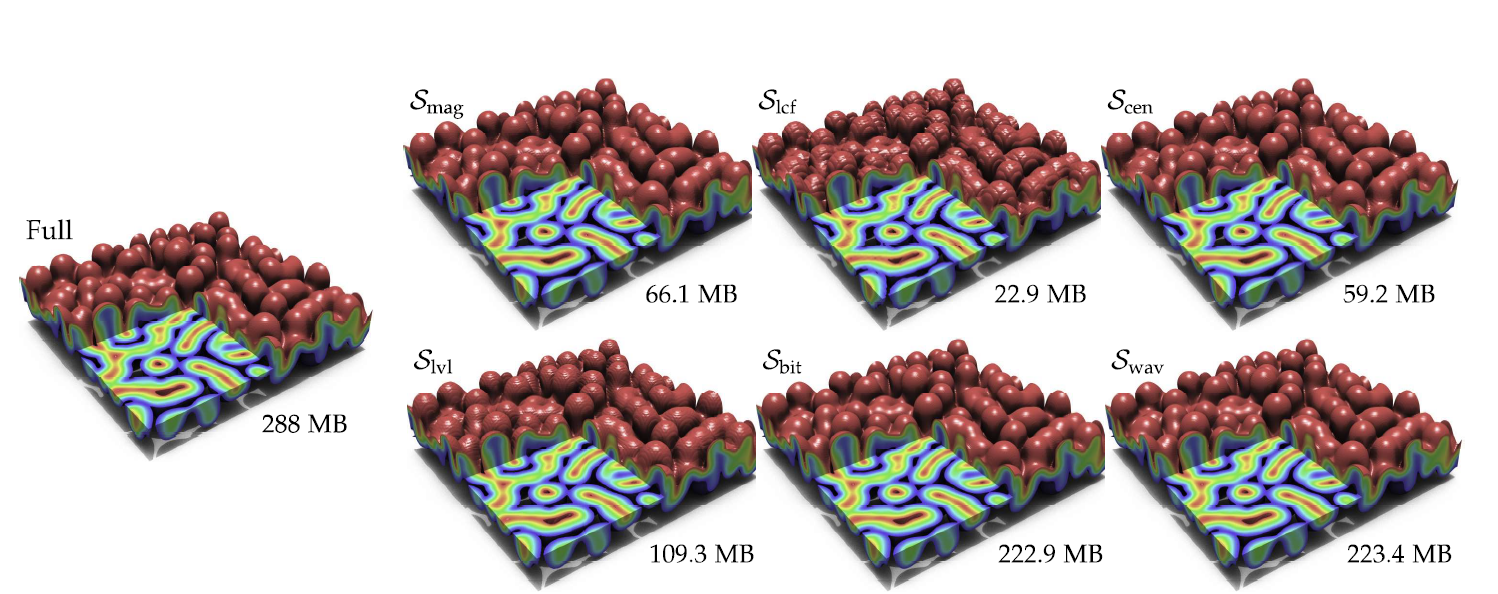
Accordingly, AMM enables comparison of different types of reduction strategies. “Our goal was not to say one strategy is better than another, but to offer a way to evaluate them easily in a consistent manner,” says Bhatia. Users may have differing goals for the same dataset, so AMM allows them to create representations for their own requirements.
Managing the massive amount of scientific data that LLNL generates every day is computationally expensive and difficult to scale. Tested with multiple types of data streams, AMM produces smaller meshes than traditional methods and demonstrates significant computational advantages. “Current HPC trends point to computation becoming increasingly cheaper while the relative cost of moving data to the processors becomes more expensive,” states Lindstrom. “Data compression and reduction techniques like AMM limit the amount of data that has to travel through a computer by eliminating redundant information, allowing results to be generated more quickly and economically.”
—Holly Auten