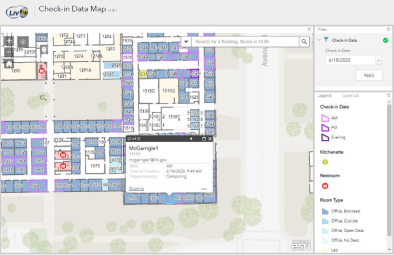
The physical distancing requirements brought about by COVID-19 required the Lab to build tools for enhanced operational awareness of building and office capacities. To this end, LivIT’s Site Operations Geographic Information Systems (GIS) team developed a spatial visualization and querying tool that synched the Lab’s extant mapping dataset of all interior spaces on site with daily data from the Daily Wellness Check-in tool to gauge the employee population density of every building, floor, and office at the Lab including estimated employee utilization ratios for each restroom, kitchen, and conference room. The project was dubbed the Check-in Data Map.
Tom Lopes, a GIS analyst who worked on the project, says, “If we hadn’t completed data truthing of the entire Lab’s interior spaces and technology upgrades in the year prior to COVID, the accuracy of this project wouldn’t have been as great, and we wouldn’t have been as nimble in developing a solution. Linking our digital maps of on-site workspaces with the Wellness Check-in data allows managers to see hotspots in a building and ensure that offices are not overpopulated. The existing datasets allowed us to stand up this solution within a week of receiving the request.”
The Check-in Data Map enables managers to make data-driven decisions about how and when to safely bring people back on site. “The intuitive mapping interface indicates employees’ proximity in an office as well as how often they are working near each other,” says GIS analyst Anna McGarrigle. It also identifies office types, like whether people are working in closed offices or open cubicles.
“We were able to indicate the daily and weekly average capacity and percent utilization and estimate the stress on shared amenities,” says McGarrigle. “Hopefully, at some point, we won’t need all these building capacity controls because of COVID, but if we ever need this data again, it will be at our fingertips,” says Dan Debus, Site Operations team lead.


