PROJECTS
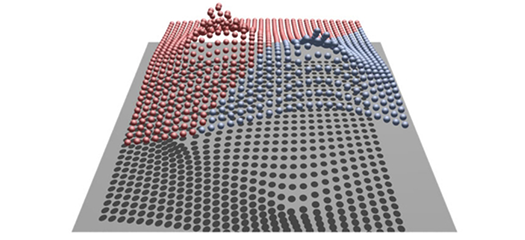
Topological Analysis
LLNL and University of Utah researchers have developed an advanced, intuitive method for analyzing and visualizing complex data sets.

Legacy
HZIP
hzip 1.0.1 is a C++ library for lossless compression of structured and unstructured meshes composed of cells with hypercube topology.

PSUADE
The flourishing of simulation-based scientific discovery has also resulted in the emergence of the UQ discipline, which is essential for validating and verifying computer models.
NEWS

Data Science Challenge tackles ML-assisted heart modeling
The event brought together 35 University of California students—ranging from undergraduates to graduate-level students from a diversity of majors—to work in groups to solve four key tasks, using actual electrocardiogram data to predict heart health.
Explainable artificial intelligence can enhance scientific workflows
Using explainable artificial intelligence techniques can help increase the reach of machine learning applications in materials science, making the process of designing new materials much more efficient.
VisIt project team adds color usability improvements
The Lab’s workhorse visualization tool provides expanded color map features, including for visually impaired users.