The classification and characterization of orbits in Poincaré plots is an analysis problem that arises in magnetic fusion simulations and experiments. Devices, called tokamaks, enable physicists to perform experiments to determine the best shape for the hot reacting plasma and the magnetic fields necessary to hold it in place. To complement the experiments, physicists also use computer simulations to gain insights into the complex physics of the plasmas, design new reactors, and select the parameters to be used in experiments.
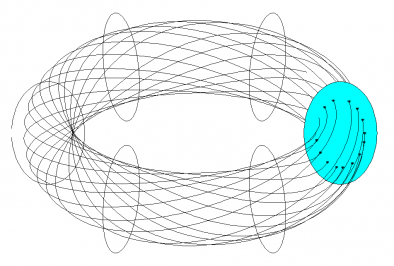
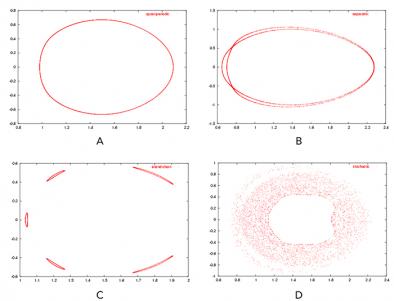
Poincaré maps or plots are obtained for planes, called poloidal planes, which intersect the torus-shaped tokamak perpendicular to the magnetic axis, as shown in Figure 1. A plot consists of several orbits, each composed of a number of points. For a given orbit, these points are the intersections of a field line (the solid lines in Figure 1) with a poloidal plane, as the field line is followed around the torus. There are four distinct shapes traced out by these points, leading to four classes of orbits: quasi-periodic, separatrix, island chain, and stochastic, as shown in Figure 2.
The assignment of class labels to the orbits is challenging for several reasons. The data for each orbit are in the form of x-y coordinates of the points that form the orbit; these must be transformed into features before we can use a classification algorithm such as a decision tree or neural network. The features extracted must be invariant to scale, translation, and rotation as the class of an orbit does not change if it is scaled, translated, or rotated. Further, the features extracted must be robust, that is, insensitive to small changes in the data, such as noise in the location of the points. We also found that the data were multi-scale - an orbit that appeared to be an incomplete quasiperiodic (or quasiperiodic) would, in high resolution, be an island chain with very thin islands (or a separatrix with very thin lobes). The class label for an orbit was also dependent on the number of points used to represent it. Some orbits started out as island chains, and as more points were added, became a separatrix, and finally stochastic. This made the manual generation of the training set very tedious.
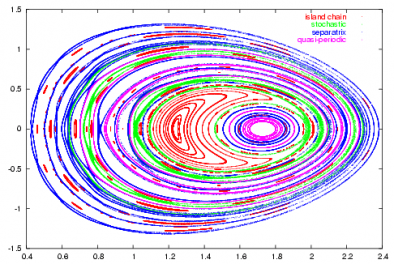
After initial experimentation with rule-based heuristics approaches such as KAM [1], we were able to design a solution approach that first transformed the data into polar coordinates, extracted appropriate features, and then used ensembles of decision trees to correctly assign class labels with a 96% accuracy rate (Figure 3). The solution has been deployed for use at Princeton Plasma Physics Laboratory.
In addition to assigning a class label to an orbit, we are also interested in extracting statistics for the orbit such as the number of islands, the number of X points in a separatrix, and the width of the lobes of a separatrix.
This work is being done in collaboration with Drs. Joshua Breslau, Neil Pomphrey, and Don Monticello from the Princeton Plasma Physics Laboratory.
Publications
For papers and presentations related to Poincaré plots, see StarSapphire Publications.
[1] K. M.-K. Yip, "KAM: A System for Intelligently Guiding Numerical Experimentation by Computer," MIT Press, Cambridge, 1991.


