
Sensors are increasingly being used to monitor complex systems, such as a tokamak or the power grid. The data from these sensors can be analyzed to
- identify, in real time, transitions to different operating regimes,
- predict, in real time, anomalies or off-normal events, and
- extract, in near real time, periods of interesting behavior.
This would allow us to control the normal operation of the grid or the tokamak better, obtain forewarning of untoward incidents which may result in cascading power outages or damage to the experimental setup, and provide insights into the behavior of the plasma or the grid.
The analysis of these data streams can be challenging. The number of sensors is often large, making the data high-dimensional. The variables being monitored may be sampled at different rates. These rates are usually very high and, with long term monitoring, lead to very large data sets. The data are often of poor quality, with noise and missing values. In addition, real time analysis is often required, so untoward incidents can be prevented. Defining an anomaly is also a challenge, especially when the statistical characteristics of the data change with time. While no real anomalies should go undetected, we need to minimize false positives.
In this project, we are developing mathematical techniques for the analysis of high-dimensional streaming data to identify concept drift and anomalies in real time, and to extract, in near real time, periods of interesting behavior for further investigation. Our research focuses on:
- preprocessing of the data streams,
- dimension reduction,
- model building, and
- real-time analysis
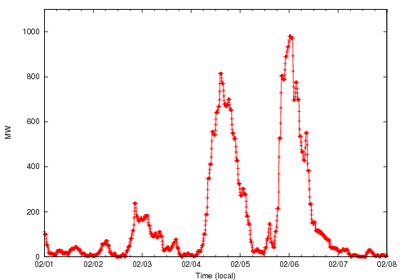
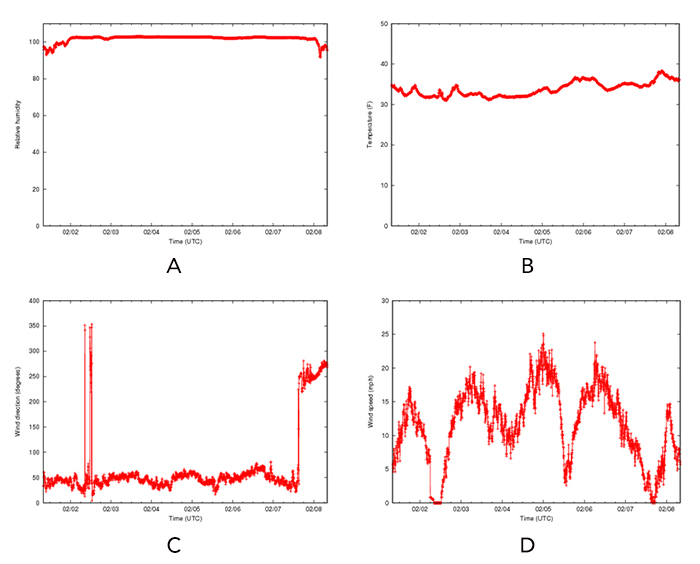
Our work is being done using two test-beds data sets: experimental fusion data from the DIII-D tokamak and wind-generation weather data from the WindSENSE project.
This project is a collaboration with Drs. Dave Humphreys, Al Hyatt, and Dave Schissel at General Atomics who provide the data and domain expertise.
Publications
For papers and presentations related to SensorStreams, see StarSapphire Publications.