
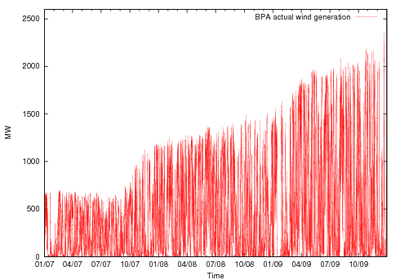
We need to understand wind resources better to manage their increased contribution to the grid (see Figure 1). WindSENSE considers the problem from the viewpoint of the control room operators. Our interviews with them have indicated that they would like 1) more accurate wind power generation forecasts for use in scheduling and 2) additional information that can be exploited when the forecasts do not match the actual generation. To achieve this, WindSENSE has two areas of focus:
Analysis of existing historical data for improved scheduling: We are analyzing historical data to improve our understanding of extreme events, such as ramps. We used simple statistical analysis to understand if ramps occur more frequently during certain months or certain times of the day, if negative ramps are as frequent as positive ramps, and if the different ramp definitions change the severity and frequency of events identified in the data. We also identified weather conditions associated with ramp events, enabling schedulers to plan for days when extreme events are likely. Our on-going work includes the identification of daily patterns in the data to provide guidance to the schedulers (for example, a rise in generation from early evening to mid-night, followed by a gradual decrease in the early morning hours).
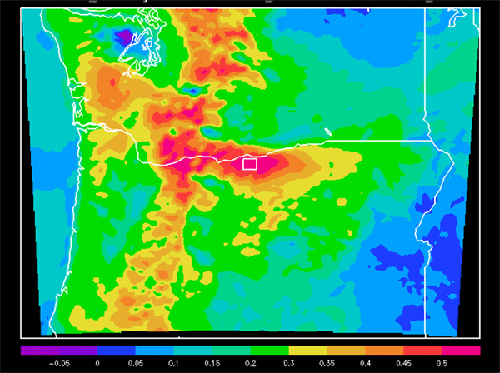
Observation targeting for improved forecast: This work, being done in collaboration with AWS Truepower, identifies the locations and types of observations that can most improve short-term and extreme-event forecasts. The wind generation forecasts used by utilities are based on computer simulations, driven by observations assimilated into the time progression of the simulation. It has been found that observations of certain variables at certain locations have more value than others in reducing the forecast error in the variable of interest, at the location of interest, for the appropriate look-ahead period. We are using an Ensemble Sensitivity Analysis approach to identify these locations and variables (see Figure 2). We have applied this approach to the Tehachapi Pass and Columbia Basin regions. We are now validating our analysis using data denial experiments and an observation system simulation experiment.
This work is joint with AWS Truepower and a collaboration with Bonneville Power Administration (BPA), California Independent System Operator (CaISO), and Southern California Edison (SCE).
Publications
For papers and presentations related to WindSENSE, see StarSapphire Publications.